

Data Center Emissions can be difficult to present because the underlying numbers mix electricity demand, grid carbon intensity, fossil-fuel share, operating period, and scenario assumptions. A useful slide deck should not treat a single figure as the whole match report. It should show the range, the baseline, and the uncertainty with enough visual discipline that a technical audience can see what changed and what remains unresolved.
The evidence base in the available research is strongest for U.S. hyperscale facilities observed between May 2024 and April 2025. One analysis of 403 U.S. hyperscale data centers, each described as roughly 40 MW in capacity, estimated electricity use of about 68–99 TWh and emissions of about 37–54 million metric tons of CO₂ over that period, with a central scenario equal to about 1.8% of U.S. electricity use and about 54% of electricity coming from fossil fuels arXiv analysis. A related Harvard-hosted report stated that those facilities emitted over 52 million tons of CO₂, represented about 1.10% of U.S. national emissions in 2023, drew electricity equal to about 2.10% of total U.S. electricity consumption, and had carbon intensity near 545 gCO₂/kWh versus a national grid average near 369 gCO₂/kWh Harvard report.
Those figures are not identical, and that is exactly why visual technique matters. A well-built graphic should help the audience separate a measurement range from a headline value. Think of it like a post-game film session: the scoreboard matters, but the sequence of plays explains why the score landed where it did.
Data Center Emissions Baseline
What The Reported Range Shows
The first design decision is whether to show one headline number or a range. For the May 2024 to April 2025 observation window, the 68–99 TWh electricity estimate and 37–54 million metric tons of CO₂ estimate are better presented as bands rather than as a single bar. A band chart lets the audience see that the low and high cases are both material, while avoiding false precision.
For a technical presentation, a horizontal range bar is usually cleaner than a dense table. Put electricity use on one line and CO₂ emissions on the next. Label the observation window directly in the chart subtitle. Use a neutral color for the range and a darker marker for any central scenario if one is included. This keeps the design honest: the center is useful, but the range carries the analytical weight.
Why Carbon Intensity Needs Its Own Slide
Carbon intensity should not be buried in a footnote. The Harvard-hosted report’s stated comparison, about 545 gCO₂/kWh for the hyperscale set versus about 369 gCO₂/kWh for the national grid average, is a strong candidate for a two-bar comparison. The visual point is simple: electricity quantity is only half the story. The emissions outcome also depends on where and when electricity is supplied.
A two-bar chart works because it avoids overloading the audience. Use the same unit on both bars, place the unit in the axis title, and avoid decorative gradients. A coach would not draw five routes on the board if only one route explains the breakdown. The same rule applies here: one comparison, one visual task, one message.
| Metric | Reported Figure | Best Visual Form | Design Risk |
|---|---|---|---|
| Electricity Use | About 68–99 TWh, May 2024–April 2025 | Range bar | Implying a single exact value |
| CO₂ Emissions | About 37–54 million metric tons | Range bar with source note | Mixing metric tons and tons without labels |
| Carbon Intensity | About 545 gCO₂/kWh versus 369 gCO₂/kWh | Two-bar comparison | Hiding the grid-average reference |
| Fossil-Fuel Share | About 54% in the central scenario | Stacked bar | Using too many categories for one slide |
Choosing Visual Forms For Hyperscale Carbon Data
Data Center Emissions Chart Choices
Data Center Emissions analysis benefits from chart forms that match the structure of the evidence. Ranges should look like ranges. Shares should look like shares. Comparisons should show common units. That sounds basic, but carbon-footprint decks often fail because they mix annual energy, operating capacity, emissions, and grid intensity on the same slide.
Use a small set of chart types and repeat them consistently. A stacked bar can show the central-scenario fossil-fuel share. A range bar can show electricity and CO₂ uncertainty. A two-bar chart can compare hyperscale carbon intensity with the U.S. grid average. A callout can carry the 403-facility sample size, but it should not compete with the chart itself.
- Use direct labels: Put values near marks so the reader is not forced to decode a legend.
- Keep units visible: TWh, metric tons of CO₂, tons of CO₂, and gCO₂/kWh are not interchangeable.
- Separate absolute and relative claims: A million-ton emissions figure and a percentage of U.S. electricity use answer different questions.
- Show the date range: The May 2024 to April 2025 window should appear close to the chart title.
For Data Center Emissions work, the most common visual mistake is adding too much context to the first chart. Context is needed, but it should arrive in layers. Start with the observed hyperscale range, then explain carbon intensity, then show electricity-source share. That sequence helps a mixed technical and executive audience stay with the evidence.
Building A Slide Sequence That Holds Up
A strong deck can be organized as a three-act analysis. The first slide answers “how much electricity and CO₂?” The second answers “why does the carbon intensity differ from the grid average?” The third answers “which assumptions change the result?” This sequence is familiar to sports analysts: establish the score, show the matchup, then isolate the variables.
For audiences comparing energy infrastructure topics, an internal companion analysis on data center energy growth may help frame grid limits and stakeholder impacts without mixing those issues into every carbon chart. Keep each slide responsible for one analytical job. If the slide cannot be explained in one sentence, the visual probably needs editing.
Evidence Limits And Presentation Discipline
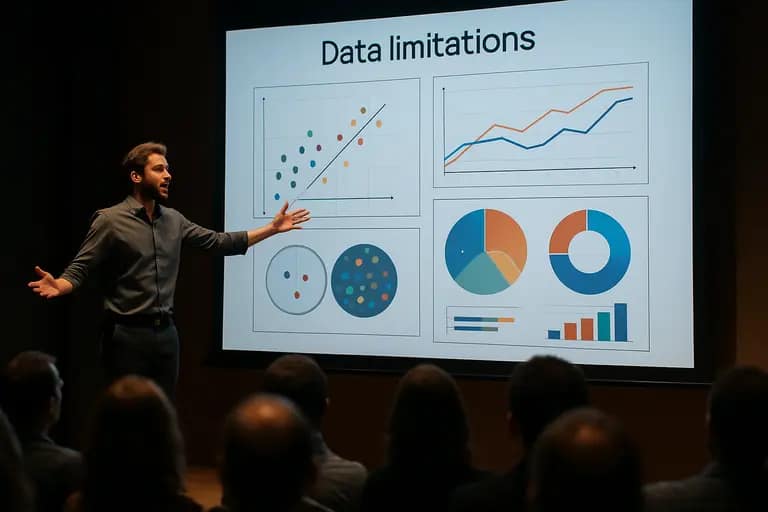
Where Uncertainty Should Be Visible
The available estimates describe a specific facility set, a specific U.S. observation period, and specific scenario assumptions. They should not be presented as a universal value for every hyperscale site or every country. A facility connected to a different grid mix can have a different emissions profile even if its electricity use is similar.
This is where cautious annotation is better than visual drama. Put assumptions in a short note under the chart. If a chart uses the 37–54 million metric ton range, do not place “54 million” in a large headline without explaining that it is the upper end of a range. If a slide uses “over 52 million tons,” keep the source and unit visible. The audience should never have to ask whether the chart is showing a range, a central case, or a separate reported estimate.
How To Avoid Misleading Comparisons
Comparisons can sharpen the story, but they can also distort it. The reported 545 gCO₂/kWh intensity being about 52% above the national grid average is a useful contrast because both values use the same unit. By contrast, placing a TWh value next to a CO₂ value in equal-sized bubbles would be weak design. The circles might look comparable even though the units measure different things.
For Data Center Emissions, a clean visual hierarchy matters. Use color to separate metric families: one color for electricity, one for emissions, and one for intensity. Do not use red only because emissions sound alarming; reserve stronger color for the analytical point you want the audience to inspect. Design should reduce confusion, not amplify emotion.
Cross-network editorial teams may also need to adapt the same evidence for broader audiences. A related site in the same network, Way Latino, highlights the importance of translating complex data-center emissions information into straightforward language, ensuring clarity for non-specialist readers.
Data Center Emissions For Hyperscale Briefings
The practical goal is not to make a dramatic carbon slide. The goal is to make a defensible one. A credible hyperscale briefing should show the observation window, facility scope, energy range, emissions range, carbon-intensity comparison, and the main assumptions without forcing the reader through a spreadsheet.
A compact five-slide structure works well: scope, electricity range, CO₂ range, carbon intensity, and assumptions. This gives analysts room to show uncertainty while giving decision-makers a clear path through the numbers. The format also protects against one of the biggest risks in carbon communication: making a precise-looking graphic from evidence that is scenario-dependent.
Data Center Emissions visuals are strongest when they behave like good match analysis. They do not celebrate a single stat. They show the pattern, the pressure points, and the limits of the evidence. For hyperscale data centers, that means treating electricity demand, fossil-fuel share, and grid carbon intensity as connected but distinct parts of the story.

