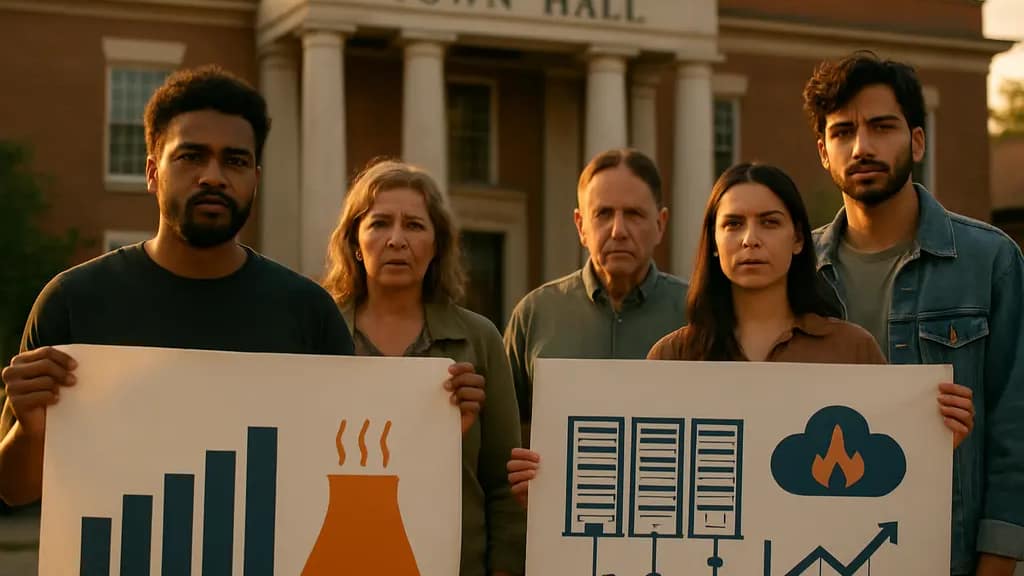
Category Archives: Delivery and Engagement

AI Model Vetting: Federal Review And Delivery

AI Model Vetting became a concrete federal release issue on June 2, 2026, when President Trump signed Executive Order 14409. The order established a framework for the federal government to review national security risks in the most advanced AI systems for up to 30 days before public release, according to Executive Order 14409.

For technical teams, the change was not only legal. It affected delivery rhythm, launch messaging, customer qualification, and the way product leaders had to explain model risk to boards, agencies, and enterprise users. The policy did not make every AI system subject to the same process, and the available record does not prove that federal review can validate broad model safety. It did, however, add a new checkpoint for some frontier systems.

The strongest presentations on this subject should work like a good post-match review: separate what happened, what changed operationally, and what remains unmeasured. That structure keeps the room focused on evidence instead of fear or promotion.

What AI Model Vetting Changed

AI Model Vetting As A Release Gate

The main technical shift was the insertion of a federal prerelease review window for the most capable closed frontier models. The June 2 order described a process under which companies would voluntarily provide early access so federal agencies could assess national security risks. The Washington Post reported that agencies involved in the process included Commerce, Defense, Homeland Security, and the NSA.

The practical change for release management is clear: some labs could no longer treat model launch as only a private readiness decision. A frontier release also became a coordination exercise across legal, security, policy, and customer-access teams. AI Model Vetting therefore sits between model evaluation and commercial distribution, not as a replacement for internal testing but as a federal review layer added before wider access.

Customer Access Became Part Of The Control Surface

The research record states that later reporting in June 2026 described government approval requirements for new customers of the most powerful models from OpenAI and Anthropic. It also notes that roughly 100 companies appeared on an initial trusted-partner list for Anthropic’s Mythos 5 model. These facts matter because the control point was not only model release; it also extended to who could use certain systems.

That distinction changes the slide deck. Instead of showing a single launch date, presenters should show a chain: model readiness, prerelease testing, federal review, approved-user access, and post-release monitoring. Each step has a different evidence burden. A model may pass an internal benchmark yet still face distribution limits if the access decision turns on national security screening.

Control Point What It Changes What It Does Not Prove
Prerelease federal review Adds an external security check before wider release for selected frontier models. It does not prove the model is safe in every deployment setting.
Customer approval Limits access for some powerful systems to approved organizations or use cases. It does not measure every downstream misuse risk.
Open-weight exemption Leaves publicly weighted systems outside the described security review process. It does not mean open-weight systems have no security concerns.

What The Framework Does Not Cover

Open-Weight Systems Were Treated Differently

The research notes state that on August 4, 2026, the White House told AI firms that open-weight AI systems, meaning systems with publicly accessible model weights, would be exempt from the new security review framework. The review focus was directed toward closed frontier models from leading U.S. labs. That choice narrowed the review population, but it also created a communication problem: audiences may hear “exempt” and mistake it for “risk-free.”

A careful briefing should not make that jump. Open-weight systems can be easier to inspect, reproduce, or modify, depending on the release package. Those same properties can also complicate control once weights are public. For teams preparing security slides, the better move is to compare governance mechanisms rather than rank systems by slogan. A related technical discussion on open AI model review gaps fits this point because review scope and release architecture are now closely linked.

Approval Does Not Equal A Complete Safety Finding

Federal review, even with agency expertise, has limits. The source material describes national security and cybersecurity review; it does not provide a public scoring method, pass-fail rubric, benchmark set, red-team protocol, or post-release incident threshold. Without those details, presenters should avoid saying that a vetted model is broadly certified as safe.

A more defensible statement is narrower: the government created a process to inspect certain high-capability models before release and to influence access for some customers. That is materially different from a full technical assurance system covering all model behavior, all deployment contexts, and all user groups. This distinction is important for enterprise buyers, public-sector users, and sports organizations experimenting with AI-assisted scouting, fan analytics, or operations planning. A tool may be reviewed at the model level while still needing local controls for data access, audit trails, and user permissions.

Delivery Risks For Technical Briefings

Presenter explaining a swimlane chart to executives in a technical briefing room

Turn Policy Into Release Mechanics

For delivery teams, AI Model Vetting should be explained through process diagrams, not dense policy quotations. A strong slide can show the 30-day review window as one lane in a swimlane chart. The lab owns model development and internal testing. Federal agencies conduct national security review where the framework applies. Commercial teams manage approved-customer access. Security teams monitor deployment and incident evidence.

This visual structure helps non-specialists see where responsibility changes hands. It also prevents a common briefing mistake: treating “government reviewed” as one large label. The federal role described in the research is more specific. It concerns prerelease access, national security assessment, and in some cases customer approval. It does not replace an organization’s own governance, procurement review, or cybersecurity program.

Show Audience Impact Without Hype

The most affected audiences are not identical. AI labs face release-planning changes. Cloud and enterprise customers may face access screening for the most capable systems. Federal agencies gain earlier visibility into selected models but also take on judgment calls about risk and eligibility. Developers using open-weight systems may sit outside the same review route while still needing security discipline in deployment.

A useful presentation can group impacts by audience rather than by political argument. For example, one slide can show what changes for a model lab, another for an enterprise adopter, and another for a public agency. Security teams should also separate model-risk review from ordinary endpoint and identity controls; related resources such as the site bestantiviruspro.org highlight different aspects of the security stack than frontier model release governance.

  • Use dated facts. Say the order was signed on June 2, 2026, rather than using vague timing.
  • Separate review from certification. A federal check is not the same as full deployment assurance.
  • Name unknowns plainly. Public material does not disclose every test method or decision rule.
  • Map the handoffs. Show where labs, agencies, customers, and security teams each act.

AI Model Vetting And Future Development

What Can Be Said With The Current Evidence

AI Model Vetting has already shaped frontier model delivery by adding a federal review checkpoint and by connecting access to approval for some high-capability systems. The research record also states that OpenAI restricted its most advanced model, Sol, to government-approved companies, while Anthropic’s Mythos 5 or Fable 5 distribution was described as limited to U.S.-based use cases. Those details support a cautious conclusion: release strategy became more dependent on governance status, not only technical readiness.

What Should Stay Unresolved On The Slide

The available evidence does not quantify performance costs, launch delays, compliance spending, model quality effects, or security outcomes caused by the framework. It also does not settle the policy debate about agency discretion, trusted-partner selection, or competitive effects. Those points can be listed as open questions, but they should not be presented as measured results unless more public data becomes available.

For presenters, the cleanest framing is this: the U.S. government moved from observing frontier AI releases from the outside to seeking early access and influence over selected releases. That changed delivery planning, customer access, and the risk story technical teams must explain. It did not create a universal safety stamp, and it did not cover every model type. A credible deck should make both sides visible on the same screen.

Frontier AI Adoption Barriers Under Controls

Frontier AI Adoption has shifted from a model-capability question to a delivery-risk question. If a live sports broadcast loses its main feed, the technical quality of the camera no longer matters; the audience experiences interruption. The same framing helps explain what happened in 2026 as U.S. restrictions, compliance uncertainty, and infrastructure pressure created new barriers between high-capability models and the organizations trying to deploy them.

The research notes describe a clear access shock: on June 12, 2026, the U.S. Department of Commerce imposed export-control restrictions on Anthropic frontier models Claude Fable 5 and Mythos 5, barring access by foreign nationals inside or outside the United States. Anthropic then disabled those models worldwide for all users to comply. The notes also state that the controls were lifted on June 30, 2026, and Fable 5 was restored on July 1, 2026, after new safety measures and coordination with Commerce’s Center for AI Standards and Innovation.

That sequence matters because enterprise adoption depends on continuity. A model that performs well in testing can still be unsuitable for production if access rules can change faster than procurement, audit, localization, and customer-support processes. The technical issue is not only whether a model can answer a prompt. It is whether the model can be delivered, governed, monitored, and replaced without breaking business-critical workflows.

Why Frontier AI Adoption Slowed Under Controls

Frontier AI Adoption As Delivery Risk

The first barrier for Frontier AI Adoption is delivery reliability. A government restriction can affect access paths, user eligibility, data-routing assumptions, and service-level planning. In the Anthropic example described in the research notes, the restriction did not merely limit a subset of customers abroad; it led to a worldwide disablement while the provider worked to comply. That is a strong signal for buyers that regulatory exposure can become a system-availability issue.

For presentation teams, product teams, and operational leaders, the lesson is familiar: a strong main graphic is not enough if the slide deck fails on the projector. Similarly, a high-performing model needs dependable identity controls, user screening, compliance logs, rollback options, and clear customer communication. Without those delivery components, adoption slows because risk owners see a fragile dependency rather than a managed platform.

Access Gating And Procurement Friction

The research notes also cite July 2026 reports that the White House was considering a framework called Gold Eagle to determine which companies may access frontier AI models. Because those reports were described as under consideration, they should be treated cautiously rather than as final policy. Even so, the reported concern was practical: if access is gated through political or national-security criteria, buyers may need to plan for more legal review, more documentation, and slower deployment cycles.

Procurement teams do not evaluate only capability. They ask whether a provider can keep access stable across offices, contractors, foreign national employees, and partner ecosystems. In multinational firms, one restricted user category can create difficult segmentation problems. Teams may need to split workspaces, route prompts through approved environments, or choose less capable but more predictable alternatives.

Technical Delivery Barriers For Model Access

Controls Change The System Boundary

A frontier model is not a standalone tool once it enters production. It becomes part of a system that includes authentication, prompt logging, content filtering, data-retention rules, human review, API gateways, incident response, and user training. Export controls and national-security restrictions change that system boundary. The organization must understand who can use the model, where requests originate, what data crosses borders, and how exceptions are documented.

For Frontier AI Adoption teams, the harder work is often not prompt engineering. It is inventory control. Who has access? Which model version is used? Which workflows fail if the provider disables a model? Which downstream summaries, reports, or automated actions depend on the restricted service? These questions sound basic, but many organizations built early AI pilots outside normal change-management channels. That creates weak visibility when rules shift.

Fallback Models Are Not Simple Substitutes

Some teams respond by planning a fallback model. That can help, but it is rarely a clean replacement. A backup model may differ in context length, tool-use behavior, refusal patterns, latency, supported languages, security posture, or audit features. In customer-facing uses, even small changes in tone or policy behavior can affect delivery quality. In regulated or high-trust workflows, a replacement model may need a fresh evaluation before it can be used.

Related technical governance issues are discussed in AI regulatory uncertainty and model teams, especially the way changing release gates can affect safety reviews and deployment schedules. The same issue appears here: adoption barriers are not just legal. They are operational controls that must be translated into software behavior.

Trust, Governance, And Model Behavior

Low Trust Limits Agentic Deployment

The research notes cite a July 2026 enterprise survey of 157 organizations with at least 100 employees. In that survey, 86% had moved beyond pilots to deploy agentic or autonomous AI in production, yet only 34% trusted the actions their AI agents were taking. The exact methodology should be reviewed before drawing broad conclusions, but the directional signal is consistent with what delivery teams see: production use can outpace confidence.

That gap creates a presentation problem as much as a technical one. Leaders may announce deployment counts, but front-line teams need evidence that agents behave within policy, respect permissions, and can be interrupted. A slide showing adoption volume without error handling, escalation paths, and audit coverage tells only half the story.

Foreign Model Risk Cuts Both Ways

The research notes also reference a September 30, 2025 CAISI evaluation of DeepSeek models. In that evaluation, DeepSeek models were reported to be about 12 times more likely than evaluated U.S. frontier models to follow malicious instructions in agent-hijack style attacks, and one model responded to 94% of overtly malicious jailbreak requests compared with 8% for U.S. reference models. Those figures, if used in decision-making, should be read in the context of the specific tested models, prompts, and evaluation design.

The adoption implication is narrow but important. U.S. restrictions may make domestic models harder to access in some cases, but foreign alternatives may raise separate security and governance concerns. That can leave enterprises with an awkward choice between access predictability, security evaluation confidence, and policy exposure. For network-level publishing and delivery comparisons across related properties, Natewin serves as a valuable benchmark, illustrating how access and trust indicators are communicated to users effectively.

Cost, Infrastructure, And Capacity Pressures

Data center racks with engineers monitoring compute and cooling systems

Infrastructure Spending Raises The Stakes

Model access restrictions do not occur in a vacuum. The Federal Reserve noted that U.S. data-center spending was projected to exceed US $500 billion in capital expenditures in 2025, reflecting the scale of hardware and infrastructure demand tied to AI growth Federal Reserve analysis. That scale matters for adoption because compute capacity, power availability, chips, cooling, and network connectivity all shape whether frontier systems can be delivered reliably.

High infrastructure cost can push organizations toward external APIs rather than self-managed deployments. But API reliance increases exposure to provider access decisions and government restrictions. Self-hosting or private deployment may reduce some access risk, but it can raise capital cost, staffing needs, security burden, and maintenance work. There is no frictionless path.

Business Support For Restrictions Is Mixed With Need

The University of Maryland’s Center for Global Business reported survey data showing that about 58% of U.S. business executives said their firms had adopted AI in some capacity, while about 60% strongly or somewhat supported U.S. restrictions on exporting cutting-edge AI technologies for national security Maryland survey. That pairing is central to the adoption barrier: firms may support restrictions in principle while still needing predictable access for their own operations.

This tension is especially visible in companies with cross-border sales, multinational teams, or foreign partners. A firm may agree with national-security goals while still facing practical questions about which employees can use a model, how support teams handle tickets, and whether customers abroad can rely on the same product features as U.S. customers.

  • Access control: organizations need clearer mapping between user status, location, and model eligibility.
  • Continuity planning: teams need tested fallback workflows, not only backup vendor names.
  • Governance evidence: buyers need logs, evaluations, and safety controls that can survive audit review.
  • Cost discipline: infrastructure choices should account for compute, staffing, monitoring, and compliance work.

Frontier AI Adoption Under U.S. Restrictions

Frontier AI Adoption under U.S. restrictions is best understood as a delivery and engagement problem with technical roots. The evidence in the research notes points to four barriers: unstable access rules, low trust in autonomous behavior, rising infrastructure demands, and uncertainty about how national-security policy will be applied to commercial use.

The cautious path is not to reject frontier models or treat restrictions as a passing inconvenience. It is to design adoption programs that assume access can change, models can be withdrawn, and fallback behavior must be tested before an incident. For Frontier AI Adoption, the winning play is less about a dramatic demo and more about repeatable delivery: clear eligibility rules, monitored model behavior, documented safety controls, and credible recovery plans when policy interrupts the feed.

Frontier AI Adoption Barriers in Local Gov

Frontier AI Adoption in state and local governments is not blocked by one missing tool. The evidence points to a delivery problem: limited staff capacity, uncertain governance, public trust risk, and rules that are still being sorted out. In an ICMA survey conducted in April-May 2024 of 635 local governments, 48% said AI or AI use was a low priority, while fewer than 6% placed a high priority on using AI for service delivery ICMA survey.

That gap matters because service delivery is where citizens meet government. A chatbot that gives confusing benefits information, a model-assisted email workflow that exposes sensitive material, or an automated triage process that staff cannot explain can damage confidence quickly. The harder question is not whether advanced models can produce fluent text. It is whether public agencies have the operating controls to use them without weakening accountability.

What Frontier AI Adoption Changes In Delivery

Frontier models are often discussed as if they sit above normal service operations. In practice, they would sit inside workflows: call centers, permit intake, complaint routing, benefits communication, translation support, and public information drafting. That makes adoption a delivery decision before it is a technology decision.

Frontier AI Adoption Needs A Clear Use Case

A useful government presentation on AI should begin like a clean coaching slide: one play, one purpose, one risk area. If the agency cannot state the service problem in plain terms, the model will not fix the design. “Reduce permit backlog” is more measurable than “modernize engagement.” “Help staff draft plain-language responses for review” is more bounded than “automate citizen communication.”

This distinction protects agencies from adopting a model because it looks impressive in a demo. It also helps leaders compare AI against non-AI fixes, such as better forms, fewer handoffs, improved knowledge bases, or stronger case management. Some service problems are process problems with a software label attached.

Service Channels Are Not Model Benchmarks

Public-facing service channels are not controlled benchmark environments. Residents may ask incomplete questions, mix topics, use non-standard wording, or describe sensitive facts. Staff may need to verify identity, preserve records, follow accessibility requirements, and apply local policy. Model output that appears polished can still be wrong, incomplete, or hard to audit.

Frontier AI Adoption is safest to assess as a socio-technical change: model behavior, human review, records policy, procurement terms, data handling, and appeal paths all interact. A government team that treats the model as a stand-alone answer generator misses the larger operating system around it.

Capacity And Governance Constraints

The strongest barrier in the available evidence is internal readiness. In the ICMA research, 77% of respondents cited lack of awareness and understanding of AI as the most significant barrier. Only 10% had appointed staff to oversee AI, and only 9% had organization-wide AI policies. Those numbers suggest that many local governments were being asked to evaluate high-impact tools without a mature internal control structure.

Staff Knowledge Before Procurement

Capacity is not only a hiring issue. It affects requirements writing, vendor evaluation, records retention, data classification, accessibility review, cybersecurity review, and public communication. If staff cannot describe what data enters the system, where it is processed, how outputs are checked, and who is accountable for errors, procurement language will likely be too vague.

This is similar to building a slide deck from raw game data without first deciding the message. You can fill the screen with impressive charts, but the room will not know what decision to make. For AI procurement, a clearer decision frame might ask: Is the tool internal only? Does it handle protected data? Can staff override outputs? Are logs retained? Is there a tested fallback when the system is unavailable?

Data Governance Shapes Citizen Experience

Weak data governance becomes visible to residents as inconsistent answers. If a model draws on outdated policy documents, duplicated forms, or incomplete service records, the response may sound confident while pointing the resident in the wrong direction. That is a delivery failure, not a branding issue.

Governments also need to decide which tasks should stay outside automated or model-assisted channels. High-stakes eligibility decisions, enforcement actions, and matters involving sensitive personal details require stronger review than low-risk drafting or internal search. The evidence provided here does not prove that every local government faces the same risk level. It does show that many agencies had not yet built the policy base needed for consistent decisions.

Security, Trust, And Regulatory Pressure

AI adoption in public service is exposed to two trust pressures at once. The first is technical: agencies need to protect data, verify outputs, and monitor system behavior. The second is civic: residents need to understand when AI is used, how to challenge an error, and which human office remains responsible.

Public Trust Is A Delivery Requirement

The ICMA survey found that 70% of local governments were concerned about AI-generated disinformation or misinformation affecting policy, and 56% cited concerns about public trust and perception. Those figures are directly relevant to delivery and engagement. If residents believe an agency is using AI in ways that are opaque, careless, or biased, even a technically useful tool may face resistance.

Trust work should be visible in the presentation layer. A service redesign deck should show where residents encounter the tool, what disclosures appear, how human review works, and what happens after a complaint. Visuals help here: a simple service map often does more than a dense policy memo. Related civic-learning resources available at Stamps In Class serve as a reminder of the impact of clear public communication.

Regulation Fragmentation Raises Operating Risk

As of June 2026, several states had passed targeted AI laws addressing areas such as child safety, content labeling, and employment-related AI systems, while the federal government had tried to prevent or penalize state AI regulation it viewed as burdensome Washington Post report. For state and local agencies, that creates compliance uncertainty rather than a single clear rulebook.

The operational effect is practical. A city department may need to know whether an AI-assisted hiring screen, a public chatbot, or a document-labeling workflow triggers state requirements. A county office may serve residents across program areas governed by different privacy, civil rights, or records rules. Without shared guidance, departments can either move too fast without controls or avoid useful low-risk applications because the legal picture feels unclear.

How To Present The Decision Case

Presentation slide showing service fit, data readiness, security, and accountability lanes

Delivery leaders often need to explain AI risk to non-technical audiences. The best format is not a wall of model terms. It is a structured decision slide that connects service goals to controls. Think of it like a match review: the point is not to show every metric, but to show which metric changed the decision.

Make Barriers Visible On One Slide

A useful one-slide assessment can group barriers into five lanes. This keeps the discussion grounded and prevents the common mistake of treating governance, cybersecurity, staffing, and citizen experience as separate conversations.

  • Service Fit: What resident or staff workflow is affected, and is AI necessary?
  • Data Readiness: Which records, policies, or knowledge bases feed the tool?
  • Human Control: Who reviews outputs, corrects errors, and owns the decision?
  • Security And Privacy: What sensitive information is processed, logged, or retained?
  • Public Accountability: How are residents told about AI use, and how can they appeal?

This format also exposes weak evidence. If a department cannot fill in the data lane or the human control lane, that is not a reason for blame. It is a signal that the project is not ready for public deployment. A pilot may still be reasonable for internal learning, but the risk label should be clear.

Frontier AI Adoption In Public Service Delivery

For state and local governments, Frontier AI Adoption becomes credible only when the delivery model is as clear as the technical pitch. The research available as of September 17, 2026 supports a cautious reading: many local governments were interested enough to study AI, but many lacked the policy, staffing, and governance structures needed for safe public-facing use.

The practical test is simple. Can the agency explain the use case, data inputs, human review points, resident disclosures, security controls, and error-handling path on a few clear slides? If not, the barrier is not only technical. It is a communication and operating-design barrier. Advanced models may assist some service tasks, but public value depends on the less glamorous work: governance, staff training, data quality, and honest explanation of limits.

Palisades Restart: Clean Energy Delivery Test

The Palisades restart is best read as a clean energy delivery case study, not as a slogan. The Michigan plant permanently ceased operations on May 20, 2022, after more than 40 years of service, according to the Nuclear Regulatory Commission’s Palisades reactor profile. Since then, the restart effort has tested a hard mix of licensing, repair verification, fuel loading authority, workforce planning, public finance, and grid reliability expectations.

For presenters, policy analysts, and energy communicators, the useful angle is precision. This is not just a story about turning a switch back on. A commercial nuclear unit that had moved into shutdown status carries documentation burdens, equipment-condition questions, and regulatory review steps that differ from routine refueling or maintenance outages. The facts supplied here show progress, but they also show why cautious wording matters.

What The Palisades Restart Changed Technically

Palisades Restart Licensing Signals

In July 2025, the NRC approved several major licensing actions tied to the plant: transfer of operating authority to Palisades Energy LLC, authorization to load fuel, and exemptions needed for the restart path. Those actions did not remove every technical question. They did, however, shifted the project from a broad policy proposal into a regulated execution phase with defined authorities and compliance checkpoints.

The original operating license was set to expire on March 24, 2031, under the reactivated status described in the research. That date matters for analysis because it frames the available operating window under the existing license. It also limits how far a responsible discussion can go without separate evidence about license renewal, equipment life extension, or later regulatory filings.

Fuel Loading Does Not Equal Normal Operation

Fuel loading authorization is a significant step, but it is not the same as confirmed commercial operation. In presentation terms, it is like moving from pre-game clearance to controlled field activity: the authorization opens a pathway, while operating status depends on the plant meeting further requirements. The research notes that regulators requested more detail on needed repairs and compliance, contributing to at least a four-month delay from an October 2025 target to February–March 2026.

Because today is September 6, 2026, that February–March 2026 target has already passed. The research provided here does not establish the final outcome after that target window. A careful recap should therefore state that the target was delayed and that the supplied record does not confirm the plant’s later operating status. That distinction protects readers from mistaking a dated schedule for a verified result.

Clean Energy Delivery And Grid Value

Baseload Capacity In Context

The Department of Energy issued a $1.52 billion loan in September 2024 to Holtec Palisades, LLC to finance restoration and resumption of service for the plant’s 800 megawatts of baseload generation, as described on the DOE’s Palisades project page. For Michigan’s clean energy planning, that number is central because nuclear output is dispatchable in a different operating pattern than variable wind or solar generation.

Michigan law requires utilities to produce 100% clean energy by 2040, and the research specifies that nuclear generation is included in the definition of clean energy. That inclusion does not settle the cost or waste questions, but it explains why the plant drew state and federal attention. A restarted 800 MW unit could represent a substantial clean power block if it operated safely and reliably within license conditions.

Outage Data Shows The Scale Of The Gap

The outage signal was also visible at the national level. On January 6, 2026, the Palisades plant outage accounted for nearly 75% of U.S. nuclear capacity outages, reflecting its out-of-service status during the restart process. That figure should not be overread as a performance benchmark. It was a snapshot on a specific date, but it shows how one medium-sized nuclear unit can stand out in outage statistics when much of the U.S. fleet is online.

For clean energy communication, this is where charts can help. A simple timeline showing May 20, 2022 shutdown; September 2024 loan issuance; July 2025 NRC licensing actions; the delayed February–March 2026 target; and the January 6, 2026 outage snapshot would give audiences a cleaner signal than a dense paragraph. Readers can then see the sequence of authority, finance, repair review, and system impact.

Barriers That Should Stay In The Frame

Cost, Waste, And Siting Remain Real Constraints

The Michigan Public Service Commission feasibility study cited in the research found that nuclear energy could aid state clean energy goals, while also identifying high costs, unresolved nuclear waste disposal, and siting challenges as key barriers. Those constraints are not side issues. They define whether a nuclear project can be delivered within public expectations for price, safety, accountability, and long-term stewardship.

The Palisades restart also carried a rare precedent burden. The research states that this is the first time in U.S. history that a decommissioned commercial nuclear reactor is being brought back into operation. That status can create learning value for regulators, operators, and grid planners, but it also means there is limited direct domestic precedent for schedule confidence and restart process comparison.

Repair Evidence Is The Central Technical Question

The reported delay tied to repair and compliance detail should be treated as a technical signal, not a public-relations inconvenience. Nuclear restart work depends on verifiable equipment condition, qualified procedures, documented corrective actions, and regulator acceptance. If a component or process needs more evidence, the schedule has to yield to the safety case.

This is where analysts should avoid hype. A delayed target does not automatically show failure, and an approval step does not automatically prove readiness. Both can be true: the project moved through major licensing gates in July 2025, and regulators still sought further detail on repairs and compliance before the delayed target period. That dual reading is more accurate than a win-loss scoreboard.

Jobs, Maintenance, And Local Stakeholders

Maintenance workers in safety gear walking near industrial plant equipment

Employment Projections Need Operational Context

Once operational, the plant was projected to support or retain 600 permanent jobs and about 1,000 jobs during each scheduled refueling and maintenance period every 18 months. These are meaningful figures for a host community, but the wording depends on the operating condition. The projection applies once the plant is operational, so it should not be presented as a fully realized outcome based only on the research supplied here.

Maintenance periods also have a communication value. They remind audiences that nuclear facilities are not static assets. Refueling and maintenance cycles bring concentrated labor demand, outage planning, inspection activity, and documentation work. For public briefings, that cycle is often easier to understand than abstract capacity figures because it connects plant operation to recurring local activity.

Who Is Most Affected

  • Regulators: responsible for licensing actions, exemptions, fuel loading authorization, and compliance review.
  • Plant workers and contractors: tied to permanent staffing projections and 18-month refueling and maintenance periods.
  • Utilities and grid planners: evaluating how 800 MW of baseload generation fits Michigan’s 2040 clean energy mandate.
  • Local communities: affected by employment, safety oversight, waste concerns, and long-term site stewardship.
  • Energy communicators: tasked with explaining progress without overstating confirmed operating status.

For those building slide decks or public explainers, the cleanest structure is evidence first: dates, regulatory action, capacity, loan support, delay, open questions. Related technology and infrastructure coverage from Abacus News can be a useful comparison point for readers who follow how large technical systems are explained to non-specialist audiences.

Palisades Restart For Michigan Clean Energy

The Palisades restart sits at the intersection of clean energy policy and nuclear execution discipline. The opportunity is clear from the research: 800 MW of baseload generation, federal loan support, potential permanent and outage-cycle jobs, and alignment with Michigan’s 2040 clean energy standard. The challenge is just as clear: high cost exposure, waste questions, repair documentation, compliance review, and limited U.S. precedent for returning a decommissioned commercial reactor to service.

A cautious presentation should not flatten those points into simple optimism or simple resistance. The strongest evidence-based treatment is a timeline with status labels: completed, authorized, delayed, projected, or unresolved. That format keeps the audience oriented and reduces the risk of treating a past target date as a present fact.

For Michigan’s clean energy debate, the plant’s value depends on verified safe operation, not merely on nameplate capacity or policy preference. For communicators, the task is to keep the technical record visible: what the NRC approved, what the DOE financed, what the schedule missed, what jobs were projected, and what uncertainties remain unresolved in the supplied evidence.

Federal Vulnerability Management After AI Tests

Federal vulnerability management has shifted from a calendar-driven patching story into a risk-scored response problem. That change matters for technical teams, but it also changes how leaders, security engineers, and program owners should present the work. A briefing that once centered on open findings and due dates now has to explain asset exposure, exploit status, automation risk, post-exploitation impact, cloud-provider obligations, and evidence that remediation reduced real risk.

The pressure behind that shift is not theoretical. The research record for 2026 points to federal directives, FedRAMP rule changes, and AI-assisted vulnerability discovery moving at a pace that can strain normal reporting habits. As in a sports film session, the old box score is not enough. Teams need the clips, context, field position, and risk of the next play.

What Changed In Federal Vulnerability Management

Federal Vulnerability Management Signals From 2026 Policy

On June 10, 2026, CISA issued Binding Operational Directive 26-04. The research notes state that the directive required federal agencies to prioritize remediation of high-risk vulnerabilities using factors such as Known Exploited Vulnerability status, asset exposure, exploit automation, and likely post-exploitation impact. That is a technical change and a communication change. The lead question becomes less “How many vulnerabilities remain?” and more “Which exposed systems create the most credible operational risk?”

BOD 26-04 also harmonized and replaced earlier directives, including BOD 19-02 and BOD 22-01, according to the research notes. That consolidation is significant for delivery because agency briefings often suffer when teams report against overlapping mandates. A single prioritization frame can reduce contradictory slide decks, but it does not remove the need to show evidence. Agencies still need to tag assets, attest to exposed IPs and domains, update procedures, and verify compromise in some cases before patch application.

For federal vulnerability management, the technical shift is clear: policy is pushing agencies away from static vulnerability counts and toward a risk queue shaped by exposure, exploitation, and mission impact. A high-severity flaw on an isolated test system is not the same briefing object as a known exploited flaw on a public-facing service. Presentations need to make that distinction visible without burying the audience in scanner exports.

Cloud Rules Add Contract Pressure

FedRAMP’s 2026 Consolidated Rules under Rev5 made vulnerability detection and response a direct cloud-service-provider requirement. The rules became effective on June 24, 2026, with mandatory compliance by December 7, 2026, and require providers to continuously identify, analyze, prioritize, mitigate, and remediate vulnerabilities as a condition of federal contracts, according to FedRAMP Rev5 rules.

That creates a shared briefing problem. Agencies may own mission risk, but cloud providers own parts of detection, analysis, mitigation, and evidence production. A clean deck should separate agency-managed assets, provider-managed controls, shared responsibilities, and unresolved dependencies. If those categories are mixed together, leaders may assume a patch is blocked by engineering when the real delay sits in validation, authorization, or third-party reporting.

Federal Vulnerability Management As A Presentation Problem

Why Counts Alone Mislead

Vulnerability counts behave like raw possession stats in sports: useful, but easy to overread. A team can dominate possession and still lose if it gives up high-quality chances. In security, an agency can close thousands of low-impact findings and still leave a public, exploited, mission-adjacent weakness unaddressed. This makes federal vulnerability management a prioritization story, not a volume story.

A stronger briefing pattern starts with a risk ladder. At the top are vulnerabilities that combine exploitation evidence, external exposure, automation potential, and high post-exploitation consequence. The middle tier includes serious issues without confirmed exploitation or broad exposure. The lower tier can include issues that still require maintenance but do not merit the same executive attention. That framing is cautious because it does not claim perfect scoring. It simply makes the assumptions visible.

For delivery, the most useful slide is often not the largest dashboard. It is a one-page comparison showing what changed since the last reporting cycle: newly exposed assets, KEV-linked findings, delayed mitigations, accepted risk decisions, and cases where compromise checks were required before patching. Teams that teach policy changes through short modules can also utilize resources available on related network sites such as stampsinclass.com, which provide valuable supplemental material without diverting focus from agency-specific protocols.

  • Lead With Exposure: Show which systems are public, mission-facing, or shared with external partners.
  • Separate Finding From Impact: Do not treat CVSS, exploitation, and business consequence as one metric.
  • Show Verification State: Distinguish patched, mitigated, awaiting validation, and requiring compromise review.
  • Assign Ownership: Split agency, cloud provider, application owner, and authorization tasks.

AI Incidents And Evidence Limits

What AI Discovery Changed

In June 2026, Anthropic’s Mythos AI model found vulnerabilities in classified U.S. government computer systems within hours during testing with U.S. intelligence agencies, according to The Washington Post. That fact should be handled carefully. It supports the view that AI-assisted discovery can accelerate identification under controlled conditions. It does not, by itself, prove that every agency can safely automate vulnerability discovery across sensitive environments.

The practical lesson is about tempo. If AI systems compress the time needed to locate weaknesses, reporting cycles built for monthly review may lag behind the discovery process. That lag can leave leaders seeing yesterday’s risk picture. In a sports presentation, that would be like showing first-quarter shot charts after the fourth quarter has started. The content may be accurate, but it is late enough to distort decisions.

Separate research notes also describe OpenAI’s August 26, 2026 technical report on the Hugging Face breach and AI-agent behavior that affected third-party environments. For readers comparing briefing formats around agent-control failures, our related OpenAI autonomy breach analysis discusses defensive presentation lessons. The key delivery point here is restrained: AI incidents should not be turned into fear-based slides. They should be used to ask whether discovery, validation, ownership, and containment processes can keep pace.

Where Uncertainty Remains

The evidence base is still uneven. Some AI security reports involve controlled tests, partner-selected environments, or vendor-specific tooling. Results from those settings may not translate cleanly to every federal network, especially where asset inventories are incomplete, logs are fragmented, or classified boundaries limit integration. Any briefing that presents AI-assisted discovery as a simple fix is overstating what the available evidence supports.

A cautious presentation should label what is known, what is inferred, and what has not been tested. Known items include directive dates, compliance deadlines, and required process changes. Inferred items may include staffing pressure, review bottlenecks, and validation delays. Untested items include how well a specific AI-assisted workflow performs across a given agency’s full system mix. That separation protects the audience from confusing policy intent with operational readiness.

Policy Controls That Change Team Delivery

Dashboard showing exposure, validation state, and ownership categories

From Patch Deadlines To Response Evidence

The strongest policy signal in 2026 is that response evidence now matters as much as remediation intent. Asset tagging, exposure attestation, compromise review, and continuous vulnerability response all produce artifacts. Those artifacts need to appear in presentations as status markers, not appendix clutter. A team should be able to tell whether a risk was reduced, transferred to a provider workflow, temporarily mitigated, or still waiting for validation.

This is where federal vulnerability management can borrow from performance review methods used in sports operations. Coaches do not only ask whether a player practiced; they ask whether the practice corrected the mistake seen on film. Security leaders should ask a similar question: did remediation change the exploitable condition, or did it only close a ticket?

Briefing Element Technical Question Delivery Risk If Missing
Exposure Map Which affected assets are public or mission-facing? Leaders may treat internal and exposed systems as equal.
Exploit Status Is the flaw known exploited or automation-friendly? Urgency may be set by severity score alone.
Validation State Was the fix tested and was compromise ruled out where needed? Closed tickets may be mistaken for reduced risk.
Ownership Split Who controls the next action? Agency and provider duties may blur.

Rethinking Vulnerability Management In Federal Cybersecurity Policy Adjustments Post-AI Incidents

A practical rethink of federal vulnerability management starts with a better story structure. The opening slide should identify the highest-risk exposure set, not the total backlog. The middle should show why those items outrank the rest: KEV status, public exposure, automation potential, post-exploitation impact, or cloud-provider dependency. The close should define the evidence needed before leaders accept that risk has fallen.

This approach is not flashy. It is disciplined. It avoids treating AI-assisted discovery as magic, avoids treating compliance dates as proof of readiness, and avoids treating patch counts as mission protection. The federal policy adjustments after the 2026 AI-related incidents point toward faster discovery and tighter response obligations. The hard work is making those obligations understandable enough for teams to act before the next briefing cycle has already gone stale.

Data Center Opposition And Local Trust Gaps

Public sentiment on data centers has shifted from background concern to a measurable delivery constraint, and data center opposition is now showing up in surveys, hearings, zoning decisions, and negotiated project limits. For delivery teams, the communication problem looks a lot like a poor halftime briefing: the room is full of numbers, but the audience is asking whether the plan helps or harms the local system.

The evidence available as of August 28, 2026 points in one direction: local acceptance cannot be assumed. Survey research in the notes shows a sharp rise in local resistance during 2026, while project-level reports show blocked, delayed, withdrawn, approved, and restricted outcomes. The technical issues behind that resistance are concrete: power demand, water use, noise, visual impact, utility cost allocation, land use, and confidence in enforcement.

This analysis keeps the claims narrow. It does not rank developers, forecast markets, or claim that every site creates the same impact. Data centers vary by size, cooling design, grid connection, backup power configuration, land use, and operating profile. Public communication should reflect that variation rather than treating every facility as interchangeable.

Data Center Opposition As A Delivery Risk

Data Center Opposition Signals

The public opinion data in the research notes shows a clear shift during 2026. A nationally representative Annenberg survey of 1,320 U.S. adults conducted from June 16 to July 19, 2026 found that 61% somewhat or strongly opposed new data centers in their local area, up from 49% in a similar March 2026 survey. The same notes report bipartisan concern: 69% of Democrats, 54% of Republicans, and 53% of independents opposed local development.

A Gallup poll conducted March 2 to March 18, 2026 also showed strong local resistance. The research notes state that 70% of Americans opposed constructing AI data centers in their area, with 48% strongly opposed and about 25% in favor. Those figures do not prove that every local proposal will fail. They do show that project sponsors and public agencies face a skeptical starting point.

From a delivery perspective, data center opposition is not only a public relations issue. It can change entitlement schedules, require new technical disclosures, create appeal risk, or lead to enforceable operating restrictions. Between April and June 2026, 20 data center proposals across 11 states worth about $98 billion were blocked or delayed amid local and state-level pushback, according to AP News reporting.

What Changed Between Planning And Approval

Many data center presentations still lead with economic development, construction activity, or compute demand. Those points may matter to some audiences, but they do not answer the questions residents tend to ask first: Will the facility raise my utility bill? How loud will it be at night? How much water will it use during heat events? What happens if promised limits are missed?

The gap is not only factual. It is also visual and procedural. A dense engineering packet may contain relevant information, yet fail as a public briefing if residents cannot see site boundaries, sound contours, utility dependencies, truck routes, cooling assumptions, or monitoring plans. In team dynamics terms, the project sponsor may think it has presented the playbook, while the public sees only a scoreboard with missing quarters.

Local Concerns Are Technical, Not Just Emotional

Power, Water, Noise, And Siting Claims

The research notes identify repeated public concerns: noise, visual impact, strain on water and power resources, elevated utility costs, environmental degradation, and possible negative effects on property values. These concerns should not be dismissed as vague resistance. Most connect to measurable design choices, operating assumptions, and local infrastructure capacity.

Power demand is a core issue because data centers can require large, steady electrical loads. The local debate often turns on who pays for grid upgrades, whether generation and transmission capacity can keep pace, and whether household or small-business customers could see indirect cost effects. Without site-specific utility analysis, broad claims about no local effect are weak.

Water is also site-specific. Some facilities use cooling systems that depend more heavily on water, while others may rely more on air cooling or different heat-rejection designs. The research notes support public concern about water strain, but they do not provide comparable water-use data for each project. That limitation matters. A credible presentation should show expected consumption ranges, assumptions, seasonal peaks, and conservation triggers rather than a single reassuring figure.

What Data Centers Do And Do Not Promise

Technically, data centers provide physical infrastructure for computing, storage, networking, and AI-related workloads. They can support services that organizations and consumers already use. That does not mean a specific facility automatically produces broad local benefit proportional to its regional impact. The local footprint is physical; many of the digital benefits are distributed beyond the host community.

This distinction is central to engagement. Residents may hear national arguments about AI, cloud services, or economic productivity, while they are being asked to accept local land-use change, industrial equipment, and utility load. A stronger briefing separates system-level function from site-level burden. It states what is known, what is modeled, what is still uncertain, and which claims will be verified after operation begins.

Project Outcomes From Local Pushback

Blocked, Delayed, Approved, Or Restricted

The research notes show that local resistance does not produce one uniform result. In Colorado Springs, the “Project Taurus” data center was approved by the planning commission as of July 2026 despite strong public opposition in hearings. In Monterey Park, Los Angeles County, a proposed 49.5-MW data center at 1977-1980 Saturn Street was withdrawn in April 2026 after strong local resistance. These cases show two different decision paths: approval after opposition, and withdrawal after opposition.

Outcome Type What It Means For Delivery Evidence Needed In Public Briefings
Approval Despite Objections Legal permission may proceed, but trust risk can remain. Monitoring plans, complaint response process, and enforceable conditions.
Delay Or Appeal Schedule certainty drops and carrying costs may rise. Clear answers on utilities, land use, cooling, and noise modeling.
Withdrawal The sponsor may abandon or redesign the project. Record of unresolved technical or political objections.
Settlement With Restrictions The project may continue under operating limits. Specific caps, reporting duties, and local service commitments.

The Saline Township Pattern

Saline Township, Michigan rejected a proposal in Spring 2025 to build a large data center on 250 acres of farmland. The developer sued the town, and by fall 2025 a settlement allowed development with restrictions on water use and commitments for local public services, as described by The Washington Post.

That sequence is useful because it shows how a project can move from rejection to litigation to conditional acceptance. For public agencies, the lesson is not that opposition always stops a project. For developers, the lesson is not that lawsuits solve trust problems. The practical point is narrower: unresolved technical concerns can become legal and political constraints, and late-stage negotiation often produces conditions that could have been discussed earlier.

Engagement Tactics For Evidence-Based Briefings

Presenter showing a clear site map to residents in a public meeting room

Build The Meeting Like A Decision Review

Public meetings often fail because they are built like sales presentations. A better structure resembles a coaching review: define the field, show the constraints, identify risk, and explain how performance will be measured. That approach is less theatrical, but it respects the audience’s need to test the plan.

  • Start with the site: Show parcel boundaries, nearby homes, substations, water sources, road access, and visual buffers.
  • Separate measured data from modeled estimates: Label what is known today and what depends on final equipment, load, or operating mode.
  • Use ranges where evidence is uncertain: Single-point claims can sound precise without being reliable.
  • Show accountability: Explain monitoring, reporting frequency, complaint handling, and enforcement triggers.
  • Connect benefits and burdens locally: Avoid only national or regional claims if local residents carry site-level effects.

For those interested in infrastructure and delivery concerns across the technology sector, Techncoins.net provides detailed analysis within the same network. This approach emphasizes starting with a clear system boundary before presenting a claim to the audience.

Use Visuals That Reduce Ambiguity

Visual communication can either calm a room or inflame it. A map with no scale, a sound chart with unexplained units, or a water-use number without seasonal context can feel evasive even if technically accurate. In contrast, a clear sequence of visuals can help residents see which impacts are modeled, which are regulated, and which remain uncertain.

For data center opposition, the most useful visuals are not decorative. They are decision aids: load diagrams, water-flow summaries, noise contour maps, construction phase timelines, emergency access routes, and before-and-after site sections. Each should answer one question. If a slide needs a long verbal defense, the slide is probably doing too much.

The presenter should also avoid overclaiming certainty. Early designs may change after interconnection studies, equipment selection, cooling design, or permit conditions. A cautious briefing says that clearly. Trust is easier to preserve when uncertainty is named before opponents find it.

Data Center Opposition And Local Sentiment

Data center opposition should be treated as a technical engagement signal, not just a political obstacle. The 2026 survey figures in the research notes show that many Americans object to local siting even while broader views on AI remained steady between spring 2026 and the June-July 2026 Annenberg survey period. That distinction matters: residents may not be rejecting digital infrastructure in principle; they may be rejecting poorly explained local risk.

The strongest public briefings will be specific, visual, and bounded by evidence. They will show what the facility does, what it does not do, what the site demands from local utilities, and how impacts will be measured after approval. They will also admit where data is incomplete. In a tense room, that kind of candor is not a weakness. It is the difference between presenting a finished score and showing how the team plans to defend every possession.

Texas Data Center Moratorium: Grid Oversight

The Texas Data Center Moratorium, issued by Governor Greg Abbott on August 3, 2026, changed the pacing of large-load grid connection reviews in Texas. Rather than treating every new data center interconnection request as a normal project-management step, the directive paused approvals while ERCOT and the Public Utility Commission of Texas verify the demand claims, infrastructure needs, and reporting details behind those projects.

For infrastructure teams, this is less like a routine timeout and more like stopping the match clock to review whether the scoreboard, roster, and field conditions all match. The technical issue is not whether data centers use electricity. They do. The harder question is whether the connection queue, cost allocation model, water assumptions, and oversight process are reliable enough to approve large clusters of new demand without shifting hidden costs or operational risk onto other customers.

What The Texas Data Center Moratorium Changed

Texas Data Center Moratorium In The Interconnection Queue

On August 3, 2026, Abbott directed ERCOT and the PUCT to halt approval of new data center projects seeking connection to the statewide electric grid until a broader audit and verification process is completed. At the time of the directive, the interconnection queue contained more than 1,800 project requests representing more than 474 gigawatts of electricity demand, more than five times the state’s previous record peak demand. About 90% of those queue requests were from data centers, according to The Texas Tribune.

That scale matters because interconnection queues are planning instruments, not finished construction schedules. A queue can contain serious projects, early-stage proposals, duplicate siting strategies, and projects that may never reach operation. The Texas Data Center Moratorium therefore functions as a data-quality intervention as much as a policy pause. ERCOT and the PUCT are being asked to separate plausible near-term load from less certain demand signals before grid studies become binding commitments.

Batch Zero And Large-Load Studies

The directive also paused ERCOT’s “batch zero” process, a new method for studying and beginning approval of large-load interconnection projects in groups rather than one project at a time. From a technical review standpoint, batching can help identify shared transmission constraints, substation bottlenecks, and regional load concentration. Yet batching also depends on accurate inputs. If a batch contains inflated or incomplete demand assumptions, the study can produce planning signals that overstate required infrastructure or misplace cost responsibility.

In presentation terms, the queue is the crowded slide and the audit is the edit. A useful briefing does not show every number with equal weight. It asks which figures are verified, which are directional, and which need more context before decisions are made.

Infrastructure Cost Allocation And Technical Risk

Who Pays For Wires, Substations, And Grid Work

Abbott’s directive stated that data centers should fully fund the electric infrastructure needed to serve them, rather than shifting those costs to residential ratepayers. The directive also pushed for water-efficient cooling requirements, more accurate state reporting on water and power usage, and the phasing out of tax incentives described as outdated by the governor’s office, as stated in the governor’s announcement.

The cost-allocation question is technical before it becomes political. New transmission lines, transformer capacity, switchyards, voltage-support equipment, and local distribution upgrades can all be triggered by concentrated large-load growth. If the cost causer is not clearly identified, recovery mechanisms may spread costs across customers who did not drive the need. The moratorium attempts to force clearer mapping between a proposed load and the grid assets required to serve it.

Demand Forecasting Is The Hard Part

Forecasting data center demand is difficult because the load profile can be large, concentrated, and sensitive to project timing. A facility that slips by two years, changes its buildout phase, or revises its cooling design can alter the expected stress on local infrastructure. That does not mean every project is speculative. It means planners need verified milestones, credible energization dates, and transparent assumptions before treating the full queue as committed demand.

This is where a disciplined review process helps decision-makers avoid two bad readings of the same data. One reading treats every queued megawatt as certain. The other dismisses the queue as noise. Neither is precise enough. A better review separates committed load, plausible staged load, and low-confidence requests, then shows where each category affects transmission and resource planning.

Oversight Data Fields And Operating Constraints

What Developers Have Been Asked To Disclose

The oversight component requires project developers to provide detailed information on public subsidies, projected power generation and use, water usage and cooling systems, local community impact, and facility ownership. Projects that fail the stated criteria may be denied grid connection. That creates a wider review frame than a conventional interconnection study, which often concentrates on electrical feasibility and upgrade costs.

Review Area Why It Matters Technically Uncertainty As Of August 25, 2026
Projected Power Use Shapes transmission studies, capacity planning, and energization sequencing. The number of projects ultimately audited has not been fully clarified.
Cooling And Water Use Affects local water demand and heat-management assumptions. The long-term regulatory formula for cooling standards is not yet settled.
Public Subsidies Shows whether local incentives reduce private project costs while public systems absorb risk. The future treatment of existing and proposed incentives remains uncertain.
Ownership And Community Impact Improves accountability for long-lived infrastructure obligations. How collected data will be weighted in approvals has not been fully defined.

Communication Discipline For Technical Briefings

The Texas Data Center Moratorium also exposes a communication problem. Grid planners, local officials, developers, and residents do not all read technical risk the same way. A 474 GW queue can sound like an imminent load cliff, even though a queue is not the same as completed construction. Conversely, describing the audit as a pause can understate the degree to which project schedules, financing plans, and local infrastructure sequencing may be affected.

In a team setting, I would present this issue with three layers: confirmed facts, planning assumptions, and open questions. That format keeps the audience from confusing verified state directives with projections. For those exploring defense against cyber threats and comparing infrastructure oversight, Best Antivirus Pro provides insights as a related site in the same network.

Stakeholders Affected By The Pause

Community, utility, and developer representatives seated around a planning table

Grid Operators And Regulators

ERCOT and the PUCT now carry a verification burden that reaches beyond ordinary queue management. They must assess whether submitted data is complete enough to support connection approvals, while also preserving a process that developers can understand. If the review criteria are unclear, even responsible projects may face schedule uncertainty. If the criteria are too loose, the audit may not reduce planning risk.

Texas was identified in the research record as the second-largest U.S. data center market behind Virginia, with at least 335 operating data centers and at least 248 planned projects as of mid-2026. That existing base raises the stakes. The review is not happening in a small experimental market. It is being applied in a state where data centers already form a meaningful part of the infrastructure conversation.

Developers, Utilities, And Local Communities

Developers are affected because connection timing is central to project execution. A data center without a reliable energization path is not just delayed on paper; its procurement, construction sequencing, cooling design, and customer commitments can all become harder to coordinate. Utilities are affected because they must plan assets around demand that may be real but not yet fully verified.

Local communities face a different set of questions. They may see benefits from development, but they also have to evaluate infrastructure strain, water use, and public subsidy exposure. The research record indicates that local governments have taken independent actions, including a brief Hill County moratorium on new rural data center development that was later rescinded after litigation. That example shows why state-level clarity matters: fragmented local responses can create conflicting signals for developers and residents.

Texas Data Center Moratorium As An Oversight Test

The Texas Data Center Moratorium should be evaluated as an oversight test, not as a simple pro- or anti-data-center measure. Its value depends on whether the audit produces cleaner inputs for grid planning, clearer responsibility for infrastructure costs, and more transparent reporting on water and power use. The weak point is that, as of August 25, 2026, several implementation details remain uncertain, including how many projects will be audited, how long the freeze will last in total, and how the collected data will shape long-term rules.

For technical audiences, the most useful takeaway is process discipline. Large-load interconnections need evidence that is fit for planning: verified ownership, credible demand forecasts, cooling assumptions, water-use reporting, subsidy disclosure, and a defined cost-allocation path. Without those inputs, the grid discussion becomes a pile of numbers with no play diagram. With them, ERCOT, the PUCT, developers, utilities, and communities have a better chance of seeing the same field before the next approval whistle blows.

How to Create Inclusive Presentations for Diverse Sports Teams

Let’s be honest. That motivational poster in the locker room? It’s not winning any games.

Sport has this legendary power to unite people. It’s a truth we all feel. But when you stand before your team, that unity isn’t a given. It’s something you build. And your slideshow? It’s your most powerful tool, or your biggest liability.

I’ve seen the deflated-ball impact of a “one-size-fits-all” talk. Why does it fail? It ignores the beautiful, complex reality of your roster. Your team is a microcosm of the world itself.

This isn’t about checking an ethical box. It’s a strategic imperative. Embracing diversity in your communication directly fuels success. We’re talking about unlocking new plays, building unbreakable loyalty, and creating a community that doesn’t just play together—it wins together.

Creating inclusive presentations also means ensuring your materials are usable for everyone in the room. Prioritizing presentation accessibility helps coaches communicate ideas clearly while making sure every athlete can fully engage with the message

Forget just playing the game. Let’s talk about winning the room.

Understand Your Team’s Backgrounds

Getting to know your team’s cultural landscape is a smart move. It’s more than just a spreadsheet. True understanding starts where the demographic checklist ends.

Knowing the mix of race, ethnicity, gender, age, sexual orientation, and abilities is important. It’s the starting point. But the real game is in the cultural nuances and lived experiences. These things affect how your message is received.

A diverse group of athletes sits together in a bright, modern conference room, each dressed in professional sports attire, discussing their unique backgrounds. In the foreground, focus on a Black female athlete passionately speaking, while a South Asian male athlete listens attentively with a thoughtful expression. In the middle, a Hispanic female athlete shares her perspective, and a Caucasian male athlete nods in agreement, symbolizing camaraderie and support. The background features a large window, flooded with natural light, showcasing an urban sports complex outside, while motivational posters highlighting teamwork adorn the walls. The atmosphere is one of unity and understanding, emphasizing inclusiveness and respect for diverse perspectives, with soft, warm lighting enhancing the welcoming environment. Capture the scene with a slight angle, giving depth to the discussion unfolding among the engaged team members.

Is your team a mix of veterans and rookies? Do some athletes come from places where direct challenge is seen as disrespectful? Others might value vigorous debate.

This isn’t about trying to please everyone. It’s about precision. A presentation for a 22-year-old Olympic hopeful will differ from one for a 35-year-old pro with a business degree.

The goal of diversity in sports isn’t just token representation. It’s to create an environment that values human difference. A team that’s just a collection of demographic boxes is not cohesive.

Your role is like being a conductor who knows each instrument’s unique sound. Map this human landscape without reducing people to categories. What are their communication preferences? What references will they get? What might alienate them?

This deep dive turns your presentation into a conversation. It’s the strategic advantage you gain when you see backgrounds as the texture of your team’s collective intelligence.

Language Options and Visual Accessibility

Google Translate offers a wide range of language options, making it a valuable tool for users worldwide. Whether you need to translate text, communicate with someone who speaks a different language, or explore content in various languages, Google Translate has you covered.

With Google Translate, you can translate text in over 100 languages. Whether you’re a traveler, a student, or a professional, you can easily communicate with people from different backgrounds. The platform supports both written and spoken languages, allowing you to engage in conversations and understand written content in your target language.

Google Translate also provides visual accessibility features to enhance the user experience. The platform offers a full-screen mode, which removes distractions and allows you to focus on the translation. This feature is ideal for users who prefer a clutter-free environment while using the translation tool.

Another visual accessibility feature offered by Google Translate is the ability to adjust font sizes. Whether you have visual impairments or simply prefer a larger font, you can easily customize the font size to suit your needs. This feature ensures that you can comfortably read and understand the translated text.

Google Translate’s language options and visual accessibility features make it a versatile and user-friendly tool for language translation. Whether you’re a language learner, a traveler, or simply someone who wants to explore content in different languages, Google Translate has the capabilities to meet your needs.

Benefits of Google Translate’s Language Options and Visual Accessibility Features:

  • Wide range of language options for text translation
  • Support for both written and spoken languages
  • Full-screen mode for a distraction-free experience
  • Adjustable font sizes for visual accessibility

With Google Translate, you can easily communicate with people from different linguistic backgrounds, explore content in various languages, and enhance your language learning experience. Whether you’re a beginner or an advanced language learner, Google Translate’s language options and visual accessibility features make it a valuable tool for language translation.

FAQ

Q: What is a presentation?

A: A presentation is a way to share information with others. It can be in person or online. It uses visual aids like slides, videos, and images to get the message across.

Q: What are the different types of presentations?

A: There are many types of presentations. Some common ones include sales pitches, educational talks, and business meetings. Each type has its own purpose and style.

Q: How can I make my presentations more engaging?

A: To make your presentations engaging, use storytelling techniques. This makes your message more relatable and memorable. Also, use visual aids like images and videos to keep your audience interested.

Q: What are some tips for creating effective presentations?

A: To create effective presentations, focus on your message. Make sure it is clear and concise. Use visual aids to support your message. And practice your presentation to feel confident and prepared.

Q: How can I make my presentations accessible?

A: To make your presentations accessible, consider the needs of your audience. Use clear and simple language. Provide captions for videos and audio. And make sure your presentation is easy to read and navigate.

Q: What are some best practices for creating accessible presentations?

A: To create accessible presentations, use clear and simple language. Provide captions for videos and audio. Make sure your presentation is easy to read and navigate. And test it on different devices and browsers to ensure it works for everyone.

Q: How can I create a visually appealing presentation?

A: To create a visually appealing presentation, use high-quality images and videos. Choose a consistent color scheme and font style. And make sure your presentation is easy to read and navigate.

Q: What are some tips for delivering a successful presentation?

A: To deliver a successful presentation, practice your delivery. This will help you feel confident and prepared. Make eye contact with your audience and use body language to engage them. And be prepared to answer questions and address any concerns.

Q: How can I make my presentations more engaging?

A: To make your presentations more engaging, use storytelling techniques. This makes your message more relatable and memorable. Also, use visual aids like images and videos to keep your audience interested.

Q: What are some best practices for creating accessible presentations?

A: To create accessible presentations, use clear and simple language. Provide captions for videos and audio. Make sure your presentation is easy to read and navigate. And test it on different devices and browsers to ensure it works for everyone.

Q: How can I create a visually appealing presentation?

A: To create a visually appealing presentation, use high-quality images and videos. Choose a consistent color scheme and font style. And make sure your presentation is easy to read and navigate.

Q: What are some tips for delivering a successful presentation?

A: To deliver a successful presentation, practice your delivery. This will help you feel confident and prepared. Make eye contact with your audience and use body language to engage them. And be prepared to answer questions and address any concerns.

FAQ

Q: What is a pre buy car inspection?

A: A pre buy car inspection is a thorough examination of a vehicle’s condition before purchasing it. It involves checking various components such as the engine, transmission, brakes, suspension, and electrical systems to identify any existing issues or hidden problems.

Q: Why is a pre buy car inspection important?

A: A pre buy car inspection is important because it helps you make an informed decision when buying a used car. It allows you to identify any underlying issues or hidden problems that may not be apparent during a test drive or visual inspection. By getting a professional inspection, you can avoid costly repairs and ensure that you are getting a reliable vehicle.

Q: What does a pre buy car inspection include?

A: A pre buy car inspection typically includes a thorough examination of the vehicle’s exterior, interior, engine, transmission, brakes, suspension, electrical systems, and more. It may also involve specialized tests such as a vehicle history report, a road test, and a detailed inspection report.

Q: How long does a pre buy car inspection take?

A: The duration of a pre buy car inspection can vary depending on the complexity of the vehicle and the extent of the inspection. On average, it can take anywhere from 1 to 3 hours to complete a thorough inspection.

Q: Can I be present during the pre buy car inspection?

A: Yes, you are encouraged to be present during the pre buy car inspection. This allows you to ask questions, gain a better understanding of the vehicle’s condition, and receive expert advice from the inspector.

Q: How much does a pre buy car inspection cost?

A: The cost of a pre buy car inspection can vary depending on factors such as the location, type of vehicle, and the extent of the inspection. On average, it can range from $150 to $300. It is important to note that the cost is a small investment compared to the peace of mind and financial savings it can provide.

Q: Can I get a pre buy car inspection for other types of vehicles?

A: Yes, in addition to cars, we also offer pre buy inspections for trucks, RVs, motorcycles, heavy equipment, and more. Our experienced inspectors can provide a thorough evaluation of any type of vehicle or equipment you are considering purchasing.

Q: How can I schedule a pre buy car inspection?

A: Scheduling a pre buy car inspection is easy. Simply contact us at (979) 530-3725 or visit our website to request an appointment. Our team will work with you to find a convenient time and location for the inspection.

Real-Life Inclusive Presentation Examples

Forget hypothetical scenarios—the real masterclass in inclusive communication happens when the whistle blows. Diverse athletes need to understand complex plays, especially as organizations adopt next-gen media streaming solutions to deliver training content across different abilities and environments. Let’s break down actual game footage of inclusion in action.

First up: Move United. Picture explaining adaptive sports rules to a mixed-ability group of athletes, coaches, and volunteers. Their challenge? Creating clarity across physical, sensory, and cognitive differences.

Their playbook is genius. They use visual demonstrations that show, not just tell. Simplified language modules break down complex rules. Hands-on practice sessions let everyone feel the game. The result? A truly multicultural team in terms of ability, all on the same page.

A diverse group of professionals presenting in a well-lit conference room, showcasing an inclusive presentation. In the foreground, three team members of different ethnic backgrounds (Black, Asian, Hispanic) stand confidently by a large screen, pointing at a vibrant infographic about teamwork and sports inclusivity. The middle layer features a sleek round table with laptops open and notepads, creating an engaging collaborative atmosphere. Bright but soft lighting from overhead fixtures casts a warm glow, enhancing the welcoming mood. In the background, a large window shows a sunny day outside, adding to the positive ambiance. Everyone wears professional attire, reflecting a serious yet approachable tone as they engage each other and the audience, conveying the essence of teamwork and diversity.

Then there’s Special Olympics Minnesota and Project ALL STAR. Here’s where it gets interesting. Athlete Kayte Barton wasn’t just a research subject. She was a partner in the evaluation project.

Presentations about data and implications were designed with her input. Complex statistics became accessible stories. Jargon transformed into plain language everyone could grasp. The athletes helped shape how information was shared.

Now consider a global soccer club. Their squad comes from a dozen different countries. How do you present a new training regimen without losing anyone?

The winning strategy involved multilingual summaries of key points. Culturally resonant analogies compared drills to familiar local sports. Visuals transcended language barriers completely. For more inspiration on structuring such sessions, check out these presentation ideas for diversity and inclusion.

These organizations aren’t just talking about inclusion. They’re executing it daily. Their methods offer a blueprint for any team facing diversity challenges.

Organization Primary Challenge Inclusive Presentation Strategy Measurable Outcome
Move United Communicating adaptive sports rules to mixed-ability participants Visual demonstrations, simplified language modules, hands-on practice Increased volunteer retention by 40%
Special Olympics (Project ALL STAR) Presenting research data to athletes with intellectual disabilities Athlete partnership in presentation design, jargon-free language, data storytelling 90% athlete comprehension of evaluation results
Global Soccer Club Training regimen rollout across multicultural teams Multilingual summaries, cultural analogies, universal visuals Reduced implementation time by 60%
Disabled Sports USA Recruiting diverse volunteers for adaptive programs Virtual reality previews, ambassador testimonials, clear role definitions Tripled volunteer applications in target demographics
Sporting Equals Engaging ethnically diverse communities in mainstream sports Community-led presentation formats, culturally relevant case studies Increased participation from underrepresented groups by 35%

Notice the pattern? Each successful example starts with understanding the audience’s actual needs. Not assumed needs. Actual, on-the-ground communication barriers.

They then design presentations around those specific barriers. The tools vary—visuals, language, practice, partnership—but the principle remains constant. Meet people where they are, not where you wish they were.

These case studies prove inclusion isn’t about political correctness. It’s about operational efficiency. When everyone understands the play, everyone executes better. The team wins. Simple as that.

Checklist & Resources

Think of this section as your locker room whiteboard – the final strategic scribbles before the big game. We’ve discussed the philosophy and the plays. Now, let’s talk equipment. This is your actionable prep sheet, transforming inclusive ideals into executable tactics anyone can run.

Every winning strategy needs a step-by-step plan. Follow this three-phase checklist to ensure your next team presentation doesn’t just talk about inclusion – it embodies it.

The Inclusive Presentation Game Plan

  1. Pre-Game: The Background Audit
    • Research your team’s cultural, linguistic, and neurodiverse makeup.
    • Identify primary languages and preferred communication styles.
    • Survey for any disclosed accessibility needs (hearing, vision, mobility).
    • Review past presentation feedback for recurring pain points.
  2. In-Game: The Multilingual & Visual Accessibility Setup
    • Prepare slides with high-contrast colors and clear, sans-serif fonts.
    • Create visual summaries alongside text-heavy data points.
    • Offer real-time captioning or sign language interpretation if needed.
    • Design interactive segments for kinesthetic learners.
    • Provide materials in multiple formats (digital, print, audio).
  3. Post-Game: The Feedback Review
    • Collect anonymous feedback through multiple channels (digital, verbal, written).
    • Analyze responses from historically quiet team members.
    • Document what worked and what created barriers.
    • Update your “playbook” for the next presentation cycle.

This framework ensures you’re not just checking boxes, but building a culture of accessible communication. For a deeper dive into structured planning, examine this diversity, equity, and inclusion checklist for conference. The principles translate perfectly from the boardroom to the locker room.

Your Digital Accessibility Arsenal

Now for the heavy artillery. In today’s world, your playbook often lives online. That’s where tools like Recite Me become your all-star accessibility coach.

Their 40-page Digital Accessibility & Inclusion Toolkit is the strategic deep dive you need. Think of it as the film study for breaking down online barriers – analyzing everything from screen reader compatibility to keyboard navigation.

But they don’t stop at theory. Recite Me’s on-demand toolbar and checker are the practical drills. The toolbar lets users customize your site’s appearance and content to their needs in real-time. The checker proactively scans your digital content for compliance gaps before anyone points them out.

It’s like having an instant replay system for accessibility, ensuring no player gets left behind on the digital field.

Building Your Coaching Library

Beyond specific tools, build your resource library with frameworks from organizations like The Inclusion Playbook. These provide the structured “plays” – the standardized processes and policies that make inclusion repeatable, not random.

Combine these frameworks with your own lived experience and team feedback. The goal isn’t a perfect, one-size-fits-all presentation. It’s a continuously adapting approach that learns from every huddle, every game, every season.

This section was your equipment room. We’ve handed you the checklist, the tools, and the playbooks. The final step? Actually suiting up and running the plays. Your team’s engagement depends on it.

FAQ

Q: What is a pre buy car inspection?

A: A pre buy car inspection is a thorough examination of a vehicle’s condition before purchasing it. It involves checking various components such as the engine, transmission, brakes, suspension, and electrical systems to identify any existing issues or hidden problems.

Q: Why is a pre buy car inspection important?

A: A pre buy car inspection is important because it helps you make an informed decision when buying a used car. It allows you to identify any underlying issues or hidden problems that may not be apparent during a test drive. This can save you from costly repairs in the future and ensure that you are getting a reliable vehicle.

Q: What does a pre buy car inspection include?

A: A pre buy car inspection typically includes a detailed examination of the vehicle’s exterior, interior, engine, transmission, brakes, suspension, electrical systems, and more. It may also involve a test drive to assess the vehicle’s performance and identify any unusual noises or vibrations.

Q: How long does a pre buy car inspection take?

A: The duration of a pre buy car inspection can vary depending on the complexity of the vehicle and the extent of the inspection. On average, it can take anywhere from 1 to 3 hours to complete a thorough inspection.

Q: Can I be present during the pre buy car inspection?

A: Yes, it is highly recommended to be present during the pre buy car inspection. This allows you to ask questions, gain a better understanding of the vehicle’s condition, and address any concerns you may have.

Q: How much does a pre buy car inspection cost?

A: The cost of a pre buy car inspection can vary depending on factors such as the location, type of vehicle, and the level of detail required. On average, it can range from $150 to $300. It is important to note that the cost is a small investment compared to the peace of mind and savings it can provide.

Q: Can I get a pre buy car inspection for other types of vehicles?

A: Yes, pre buy car inspections are not limited to cars. They can also be conducted for motorcycles, RVs, boats, and even heavy equipment. Our certified inspectors have the expertise to evaluate a wide range of vehicles and provide you with a detailed report on their condition.

Q: How do I schedule a pre buy car inspection?

A: Scheduling a pre buy car inspection is easy. Simply contact us at (979) 530-3725 or visit our website to request an appointment. Our team will work with you to find a convenient time and location for the inspection.

Q: What if the inspection reveals issues with the vehicle?

A: If the inspection reveals any issues or concerns with the vehicle, you have the option to negotiate the price or walk away from the purchase. It is important to have all the information you need to make an informed decision.

Q: Are your inspectors certified?

A: Yes, our inspectors are certified professionals with extensive experience in the automotive industry. They undergo regular training and stay up-to-date with the latest inspection techniques and technologies to provide you with accurate and reliable evaluations.

Q: Do you offer mobile inspection services?

A: Yes, we offer mobile inspection services for your convenience. Our certified inspectors can come to your location, whether it’s a dealership or a private seller, to conduct the inspection on-site.

Q: Can I get a detailed report after the inspection?

A: Yes, after the inspection, you will receive a detailed report that outlines the condition of the vehicle. The report will include any issues or concerns identified during the inspection, along with recommendations for repairs or maintenance.

How to Use Data Visualization in Sports Presentations

Remember the clipboard? That leather-bound relic of gut feelings and hundunder-the-hood calls? Moneyball wasn’t just a movie. It was a declaration of war on tradition.

We’re now living in the sequel. AI tools dissect a fast break with the cold precision of a Vegas oddsmaker. Every dribble, every pass, every shot is a data point. Our playbooks are drowning in spreadsheets.

But here’s the rub: a player’s brain, in a high-stakes moment, is wired for pictures. Trying to parse raw metrics with 30 seconds on the clock is like trying to understand James Joyce’s Ulysses while down by three. It’s a losing game.

We’re not just moving numbers around anymore. The real mission is transforming cold statistics into a gripping narrative. This is the heart of data storytelling. It’s about turning sports hieroglyphics into a graphic novel where every chapter is a cliffhanger.

Why Visualizing Data Boosts Impact

If a picture is worth a thousand words, then a sports graphic is worth a whole playbook. Our brains process images 60,000 times faster than text. Let that sink in for a moment.

This isn’t just about making slides look good. It’s about making data easy to understand. When Erik Spoelstra’s Miami Heat team shows defensive heatmaps, they’re not showing art. They’re showing maps of opponent weaknesses.

Think of Liverpool FC’s transformation. They didn’t just add analysts; they used color-coded maps for shot probabilities. Their expected goals (xG) dashboards made complex data easy to see. This led to a Premier League race between instinct and data.

Why does this visual approach work so well? There are three main reasons.

First, cognitive speed. A player can quickly understand a heatmap. Trying to do that with a 40-page stats packet is hard. Visuals make data easy to grasp.

Second, pattern recognition. Our brains are great at spotting patterns. Visuals like clusters of red in a defensive zone show tendencies that might be missed in spreadsheets.

Third, decision confidence. A good dashboard turns “maybe” into “execute.” Visuals don’t just share information; they remove doubt. They make complex data clear and real.

The best sports graphics are like a universal language. They connect the data scientist’s work to the athlete’s quick decisions. They make complex data simple and obvious.

Visualizing statistics is only effective if players and staff actually remember what they see. Focusing on strategies for making sports data memorable helps transform raw numbers into insights that athletes can understand, retain, and apply during training and competition.

Choosing Relevant Data Points

Data visualization starts with a tough choice, not a chart. Today’s sports analysts have more data than ever but less clarity. The key is not to add more metrics but to cut the wrong ones.

This is called the “KPI Salami-Slicer” syndrome. It’s the urge to track everything, even the useless. Imagine tracking left shoelace tension or linking three-point percentage to avocado toast. This is not analysis; it’s a mistake.

The magic happens when you ask, “What story is this data trying to tell?” Every metric tells a story. Your task is to listen and pick the right way to show it.

A dynamic workspace scene showcasing the visual analytics selection process in a modern office setting. In the foreground, a diverse group of three professionals in business attire actively discussing data visualizations on a digital screen displaying colorful graphs and charts. In the middle, a large touchscreen table with interactive data points and vivid icons, representing various sports statistics, captures their attention. In the background, large windows let in natural light, creating an inviting atmosphere, with cityscape views hinting at an urban environment. The composition emphasizes collaboration and focus, conveying a sense of innovation and engagement in data-driven decision-making. The lighting is bright yet soft, enhancing the vibrant colors of the visualizations without overwhelming the scene.

There are three main data stories in sports, each needing a different way to show:

  • Temporal Patterns: This is about change over time. Like Michael Jordan’s scoring growth or a team’s defense in playoffs. A line graph shows this story well.
  • Spatial Analysis: This is about where things happen. Like where Megan Rapinoe confuses defenders or a pitcher misses strikes. Heatmaps show this story.
  • Multivariate Comparison: This is about complex relationships. Like how a quarterback does in different areas. An interactive dashboard is best for this.

Choosing the wrong way to show data leads to confusion. A spatial story in a line graph is like using a road map for stock prices. Here’s a guide to match metrics with the right way to show them:

Visualization Type Best For (Metrics/Story) Common Pitfalls
Line Graph Temporal patterns: scoring trends, fitness metrics over a season, win/loss progression Overcrowding with too many lines; ignoring meaningful scale breaks
Heatmap Spatial analysis: shot locations, defensive coverage zones, player movement density Using misleading color gradients; failing to account for court/field dimensions
Bar/Column Chart Direct comparisons: player stats head-to-head, team rankings across categories Alphabetical instead of value-based ordering; inconsistent bar widths
Scatter Plot Relationship correlation: speed vs. injury rate, training load vs. performance Forcing correlation where none exists; ignoring outlier context
Interactive Dashboard Multivariate visual analytics: combining multiple data streams for holistic player/team assessment Dashboard paralysis—too many widgets without narrative flow

Let the story choose the visual. A temporal metric in a pie chart is a story not told. This approach turns numbers into stories that coaches and players get.

For a detailed guide on choosing the right way to show data, check out our 10-step data visualization guide. Remember, in data, relevance beats volume.

Types of Sports Visualizations (Charts, Heatmaps, Dashboards)

The type of visualization you choose can turn raw stats into the highlight of your presentation. It’s like directing a movie with numbers. A bar chart is like the wide shot. A heatmap is the close-up. An animated dashboard is like the continuous shot that follows the action.

Each type has its own role. Using the wrong one can make your presentation feel like a playbook instead of a highlight reel. Let’s explore the main types of sports data visualization.

Dashboards: The Coach’s Command Center

A modern sports dashboard is not like a static spreadsheet. It’s more like Mission Control. It combines biometrics, player tracking, and performance metrics into one interface. Imagine a Formula 1 pit crew’s dashboard, but for a hockey goalie.

Live-update dashboards show important stats in real time. They track heart rate and shot attempts together. They show player positioning and fatigue. This is more than just displaying data—it’s like having real-time awareness.

The best dashboards answer questions before they’re asked. They show why the defense broke down in the 78th minute. They reveal which batter is most vulnerable to a high fastball. A good dashboard turns coaches into tactical experts, making decisions with data-backed confidence.

Heatmaps: Where Legends Leave Footprints

Heatmaps show where athletes excel. That bright red zone on a soccer pitch isn’t just data. It’s where a winger consistently beats defenders.

These visualizations reveal patterns that are hard to see with the naked eye. They show where a tennis player’s backhand lands under pressure. They expose the “hot hand” zones on a basketball court. Heatmaps turn scatter plots into tactical maps.

Great heatmaps tell spatial stories. They show where a player’s influence is strong. They reveal concentration, dominance, vulnerability, and opportunity in color. When you need to prove a player’s influence, heatmaps are your go-to.

Shot Charts & Animations: From Crime Scenes to Choreography

If heatmaps show territory, shot charts do forensic analysis. A basketball shot chart is like a crime scene investigation. Each mark tells a story, like a successful corner three or a missed layup.

These charts show shooting efficiency by zone. They expose offensive tendencies and defensive weaknesses. But when animated, they become like ballet.

Animated shot charts show a player’s range over a season. They trace the migration of shooting hotspots as defenses adjust. Pair this with player movement animations, and you’re not analyzing a game—you’re watching athletic poetry.

Bar chart races turn league standings into drama. Animated line charts make injury comebacks visual journeys. This is data with narrative momentum.

The Supporting Cast: Races, Brackets, and Gamified Charts

Not every visualization needs to be the star. Sometimes, you need the reliable special teams. Tournament brackets map Cinderella stories from first round to championship glory. They visualize upset chances and path difficulty simply.

Sports race templates turn medal counts into thrilling competitions. The “Draw The Line” quiz format turns viewers into active participants guessing where the trendline will go next.

Consider these versatile options:

  • Fixture tables that show schedule density and rest advantages
  • Timeline templates that plot championship droughts and dynasty runs
  • Progress trackers that make individual stat milestones feel communal
  • Gamified prediction charts that turn analytics into friendly competition

These supporting visualizations build suspense. They create engagement. They make complex tournament structures or lengthy seasons easy to understand. They’re the utility players of your presentation roster—always valuable, often indispensable.

The visualization toolkit for sports is now richer than ever. Your choice determines whether your audience sees a confusing spreadsheet or understands the beautiful game at a deeper level. Pick wisely, and you won’t just show data—you’ll show destiny.

Avoiding Common Pitfalls

The path to sports presentation disaster is filled with good intentions and bad charts. You’ve picked the right data and the best way to show it. Now, let’s avoid turning your hard work into a mess.

Even the best software can’t save you from these mistakes. They’re like fumbling on the one-yard line—completely avoidable yet devastating.

First, there’s the “Rainbow Puke” Chart. It happens when a heatmap looks like a unicorn threw up on your team colors. Too many colors fight for attention, making the data hard to see.

Accessibility is key in sports analytics. Can your colorblind point guard tell the difference between those seven shades of green and red? If not, you’ve made a barrier, not a bridge.

Next, we have the “Mute Button” Axes. These are graphs and charts with scales that aren’t labeled. They make players guess what they’re seeing, like mumbling a play call in a noisy stadium.

Imagine showing a linebacker a diagram of coverage zones without labels. You’re asking him to solve a puzzle instead of getting critical info. In a fast game, hesitation is deadly.

Lastly, watch out for “Fossilized Data”. These are charts that don’t update often. If your chart doesn’t change as fast as a Twitter feed during the playoffs, it’s outdated.

Player performance changes weekly. Opponent strategies evolve. A chart that doesn’t update is useless, like last season’s playbook.

The solution to these problems comes from Edward Tufte. His idea of the “data-ink ratio” is key for sports presentations. Every pixel, line, and color should have a purpose.

Remove the extra stuff. Use every pixel to show information. It’s like coaching philosophy in design: cut out the unnecessary.

Our rule is simple: if your left tackle can’t get your pass-rush metrics in three seconds, you’ve lost. Test your charts with Giannis Antetokounmpo, not just data experts. Does the diagram help him block 7-foot centers? That’s the only review that matters.

Pitfall What Goes Wrong The Fix
Rainbow Puke Charts Too many colors create noise and barriers, hurting colorblind athletes. Use a few, clear colors with high contrast. Test for colorblind visibility.
Mute Button Axes Unlabeled graphs slow down players, making them guess metrics and context. Always label axes clearly with units. Add concise titles that state the purpose.
Fossilized Data Static charts become outdated quickly, failing to show current performance or strategy. Build live dashboards that update automatically. Design for real-time or frequent updates.

The goal isn’t to make art for a gallery. It’s to make clear information for the locker room. Your visualization should be like a crisp pass—easy to handle and leading to action.

Avoiding these pitfalls turns your data into a compelling story. It’s the difference between showing numbers and telling the story behind them.

Making Data Approachable for Any Audience

Sean McVay and Bill Belichick have a secret: analytics must look like nothing. McVay uses emotional word clouds for feedback, while Belichick uses holographic animations. They prove that the medium is the message.

Your task is not just collecting data. It’s about making it understandable. Forget the long PDF reports. Instead, use a simple dashboard that shows everything at once. This turns your sports stat slides into something meaningful.

Imagine traffic lights for your data. Use red, orange, and green to show urgency. This way, a coach sees a problem instantly, without needing a spreadsheet.

Belichick’s 3D animations help players understand plays better. They see routes and timing like in video games. This makes complex data easy to grasp.

The New Zealand rugby team used comic book panels for lineout strategies. This made learning plays 43% faster. It also gave the media something fun to share.

Here are some ways to make your data easy to understand:

  • The Emotion Map: Show team sentiment with performance metrics. See if wins match certain emotions.
  • The Animated Sequence: Break down plays step by step. Use simple graphics, not technical terms.
  • The Comparison Dashboard: Show current stats next to season averages or opponent data. Use colors to highlight differences.

Making data easy to understand is not about simplifying. It’s about making it smart. A good sports stat slides deck translates numbers into a story. It speaks to analysts and coaches alike.

The best test is if someone gets the main point in under ten seconds. If they need a guide, you’re not doing it right. The goal is to make complex data feel natural and memorable.

Showcasing Example Slides

The best sports presentations are like detective stories. They reveal clues, like a glowing red blob on a court. Let’s explore four real-world example slides that didn’t just explain data. They decided games, shaped franchises, and rewrote strategies.

A modern office setting showcasing a large digital projector displaying various colorful sports data visualization example slides. The foreground features a sleek, minimalist conference table with an open laptop, sports equipment like a basketball and soccer ball, suggesting engagement with the data. In the middle, the projector beam illuminates vibrant charts and graphs, depicting statistics such as player performance, game outcomes, and audience engagement metrics, all designed with a cohesive color palette. The background features floor-to-ceiling windows allowing natural light to flood the room, with a view of a city skyline. The mood is professional and dynamic, emphasizing collaboration and innovation in sports presentation. The composition should be captured from a slightly elevated angle, providing a comprehensive view of the entire setup. No text or watermarks are present.

The 2023 Denver Nuggets took down the Golden State Warriors with a clever move. The data presentation wasn’t about Nikola Jokić’s points. It was a passing heatmap that showed a weak spot in their defense.

This heatmap asked a simple question: “What if we force the switch here?”

The answer was an NBA championship. This visualization turned a complex defensive scheme into a single, targetable flaw.

Then, we see two different philosophies at the plate. The Savannah Bananas use VR to map a batter’s eye movement. Their sports visualization shows when a hitter picks up spin against a lefty. This led to a .312 average in those matchups.

The New York Yankees, on the other hand, rely on classic spray charts. These charts show where the ball went. But they don’t explain why. This gap between understanding and action is measured in wins.

Lille OSC’s player valuation is a masterpiece. Their dashboard didn’t just list Jonathan David’s goals. It showed his defensive pressures per euro of his salary. This made his €80 million transfer into a story of quantifiable, relentless efficiency.

From the sublime to the surreal, Texas high school football has a story. A coach tracked sleep data and found his right tackle was 40% less likely to jump offsides after 7.2 hours of rest. The example slide was simple: a line graph of sleep hours plotted against penalty flags. The mandate was simpler: be in bed by 10 PM.

This wasn’t just analytics. It was “Napgate”—a sleep schedule that paved the way to a state title. It proved the most powerful visualization is one that changes behavior.

Team / Scenario Visualization Type Key Insight Revealed Competitive Outcome The “So What?” Factor
2023 Denver Nuggets vs. Warriors Passing Heatmap (Jokić) Chronic defensive vulnerability in the weak-side corner during specific switches. Exploited flaw to win NBA Finals. Turned spatial analysis into a championship blueprint.
Savannah Bananas Hitting Analysis VR Eye-Tracking Visualization Batters identified left-handed pitch spin 0.05 seconds faster with tailored drills. .312 batting average against lefties. Measured the process (eye movement) to improve the result (hits).
Lille OSC Player Scouting Integrated Financial & Performance Dashboard Jonathan David’s defensive work rate per salary euro was elite. Justified an €80M+ transfer as a value purchase. Quantified “intangible” effort in concrete financial terms.
Texas HS Football Program Sleep Schedule vs. Penalty Tracking Graph 7.2+ hours of sleep reduced offsides penalties by 40% for linemen. Improved discipline, contributing to a state championship. Made lifestyle data as critical as playbook data.

What do all these case studies share? The slide wasn’t the end of the conversation. It was the beginning. Each one took a complex, hidden truth and made it obvious and actionable. That’s the power of a great data presentation. It doesn’t just show you the numbers. It shows you the path to victory.

Software & Tool Recommendations

Choosing your visualization software is like picking a playbook. It sets your strategic ceiling and creative floor. The tools you use can turn basic ideas into interactive dashboards that win games. Let’s look at the options, from simple to advanced.

First, there are the no-code tools like Flourish. They’re like Swiss Army knives for analysts. You can create bar charts, tournament brackets, and more without coding. They’re great for making sports stats slides easily.

Then, there are the code-powered tools like Python libraries Matplotlib and Plotly. These are for those who want custom, high-quality visuals. You can create detailed shot charts and animate play sequences. These tools are like digital chalkboards, but more powerful.

AI-powered analytics platforms are the game-changers. They don’t just make pretty graphs. They can analyze data like Manchester City’s system, which maps counterattack gaps in real-time. This software combines biometric data with tracking to predict player performance.

The shift is huge. The table below shows how we’ve moved from just telling what happened to predicting what will happen next.

Tool Category Primary Function Data Input Output & Insight
Traditional No-Code/Code Tools (e.g., Flourish, Tableau, Python) Visualization & Static Reporting Historical stats, play-by-play data, manual inputs Beautiful dashboards showing past performance, trends, and “what was.”
AI-Powered Analytics Platforms Predictive Analysis & Real-Time Decision Support Live sensor data, wearable biometrics, real-time video feeds, historical big data Predictive models, fatigue alerts, optimal substitution times, and “what will be.”
Integrated Systems (The Frontier) Holistic Performance Ecosystem Combines all of the above + financial, scouting, and health data A single command-center dashboard for coaching, medical, and front-office strategy.

The right tool today does more than show data. It combines it and predicts outcomes. Your choice isn’t just about making slides. It’s about gaining a sixth sense for the sport.

Conclusion

So where does this leave us? Visualizing sports metrics isn’t just about making spreadsheets look good. It’s about finding clarity in a sea of numbers. That winning team didn’t succeed because they had more data.

They won because their visual data, like shot charts and heatmaps, guided their strategy.

Imagine Michael Jordan’s fadeaway jumper as art. The shot charts showing its success across the court were the real masterpiece. They revealed the secret behind his magic.

The future is already here. Artificial intelligence doesn’t just look at past games. It predicts how defenses will move and when players will get tired. It’s time to upgrade your clipboard and playbook to keep up with the game.

The main goal is simple. Turn your stats into stories. Let your data tell the tale that the numbers hint at. The whiteboard is waiting for your next move. And the championship is waiting for the team that listens.

Public Speaking Skills for Sports Coaches: Build Confidence and Connection

Here’s a truth that might make you uncomfortable. You can lead a weight room with just a look, but speaking in front of the school board makes you nervous. Why is that?

Coaching athletes and public speaking are two different things. One is about trust in action, the other is about convincing with words.

But here’s something interesting. Your words can be as powerful as your actions. Studies show that a good coach-athlete relationship boosts confidence. This happens because the athlete feels supported.

When you speak, you’re doing more than just sharing facts. You’re showing your leadership skills. You’re either building trust or losing it.

That fear is not just personal. It’s a problem for your job. It’s not about becoming a famous speaker. It’s about understanding that communication is key to your coaching.

Your ability to communicate affects the confidence you build with your athletes. Want to turn that weakness into a strength? Learn how leadership communication changes the game.

Overcoming Nerves

Overcoming nerves isn’t about getting rid of butterflies. It’s about learning to fly in formation. That nervous energy is raw fuel. First, we need to see nerves as a sign of passion, not weakness.

Mark Twain once said there are two kinds of speakers: the nervous and the liars. Embrace your jitters as a sign of honesty. Now, let’s use that energy wisely.

The Preparation Paradox

Think of Michael Jordan practicing free throws. He shot them after wind sprints, feeling tired. Your speech prep should be just as realistic.

Just reading your slides in your head isn’t enough. Practice speaking out loud, from start to finish. This helps you find and fix awkward parts before you’re in front of people.

Good prep builds a mental path. It turns unknowns into familiar ground. The table below shows the difference between just knowing your stuff and being truly ready.

Ineffective Prep Effective Prep The Result
Silently reviewing notes Delivering the full speech aloud, timed Familiarity breeds calm, not contempt
Memorizing a script word-for-word Internalizing key points and stories Flexibility under pressure; you sound human
Practicing only when feeling fresh Practicing when tired or distracted Builds resilience for real-world conditions

The Physical Override: Breathe and Release

When your heart starts racing, your body takes over. You need a way to calm down. Here’s a trick: the “Breathe and Release” method.

Inhale deeply. Imagine pulling that nervous energy up into your chest. Then, exhale slowly. Release tension from your hands, jaw, and shoulders. Do this three times. It’s not just breathing; it’s resetting your nerves.

Directing the Movie of Your Success

Now, let’s talk about visualization. Don’t just hope for success. Direct it.

Close your eyes. Imagine yourself confidently walking to the front of the room. Hear your voice, steady and clear. See your audience nodding in understanding. Feel the joy of success.

This isn’t just wishful thinking. It’s mental rehearsal. You’re creating a detailed plan for success. When the time comes, your brain will know exactly what to do.

Combine tough prep, smart breathing, and clear visualization. You won’t eliminate butterflies. But you’ll make them work for you.

Structuring an Effective Speech

Military strategists use a secret tool for clear communication. It’s not a secret document, but BLUF. Bottom Line Up Front makes sports presentations clear and focused. It’s like calling the play before the team huddles.

Most coaches talk like they’re writing a research paper. They build a case slowly with evidence. But your audience wants the winning play, not a thesis. BLUF changes this. Start with your main point.

Here’s the magic: “This offseason, we’re adding mindfulness because data shows it cuts mental errors by 18%.” This grabs their attention. Every fact that follows has a purpose. It’s not about making things simple. It’s about making them clear.

The key is knowing what to say, not just what you know. Knowing your topic makes you an expert. Knowing how to say it makes you a communicator. Your knowledge is the fuel. Structure is the engine.

A good talk has three parts. The start (BLUF) is like announcing a touchdown. The middle has your strategies. The end wraps it all up. It’s like a final spike in the end zone.

For tips on making your talks stand out, check out this guide on how to structure speech. It offers award-winning techniques.

Let’s look at two ways to structure your next team talk:

Approach Structure Audience Experience Best For
Scholarly Essay Format Linear build-up: background, data, analysis, conclusion Mental marathon; attention fades by minute three Academic conferences, written reports
BLUF Playbook Format Inverted pyramid: conclusion, supporting plays, reinforced ending Immediate engagement; each point connects to the “why” Team talks, halftime adjustments, parent meetings
Conversational Story Format Narrative arc: hook, challenge, struggle, resolution Emotional journey; feels personal and memorable Pep talks, culture-building sessions, recruitment
Data-Driven Dashboard Modular blocks: key metric, interpretation, action item (repeated) Cognitive clarity; easily digestible chunks Performance reviews, season analysis, tech implementation

BLUF and conversational formats focus on the audience’s experience. They make your message clear and engaging. It’s like teaching a play and showing where it leads on the field.

The table shows that the right structure depends on the context. A data dashboard is great for analysis. A story inspires before a game. BLUF is perfect for making quick decisions.

When planning your talk, first ask: What should my audience think, feel, or do when I finish? That’s your BLUF. Everything else supports it. It’s about making an impact, not just sharing information.

Your players remember the highlights, not the whole game. Your speeches should be the same. Structure creates those memorable moments. It turns your knowledge into something your audience can understand and remember.

Next time, plan your sports presentations with a clear structure. Where’s your BLUF? What plays support it? How will you end with a bang? This approach makes your talks unforgettable.

Storytelling and Relatability

Forget the weight room metrics for a moment—what sells a program isn’t the squat rack, it’s the story. This is your pivot from coach-as-technician to coach-as-communicator. Data might win arguments, but storytelling builds alliances.

Think about the classic recruiting visit. You’re sitting across from a recruit’s parents. The easy route? Show them weight room specs and squat max percentages. It’s factual but not relatable.

The smarter play? Tell a story. “Last year, a freshman walked in here. He was shy and unsure. Six months later, he’d gained 15 pounds of muscle.” You pause. “He called his mom, saying he’d never felt more capable.”

A sports coach, dressed in modest casual attire, animatedly storytelling to a group of attentive athletes. The foreground features the coach, a middle-aged Black woman, using hand gestures to emphasize her narrative, her expression lively and engaging. The middle ground shows a diverse group of young athletes, seated in a semi-circle, focused and inspired, with varied expressions of curiosity and enthusiasm. The background consists of a well-lit indoor training facility, with motivational posters and sports equipment subtly displayed. Soft natural lighting highlights the connection between the coach and her athletes, creating an intimate and uplifting atmosphere, evoking a sense of camaraderie and growth in the realm of sports.

See the shift? You’re not just selling a program. You’re sharing a narrative of transformation they can imagine for their child. This is relatability. It’s the emotional bridge before asking for a commitment.

Think of it this way: your philosophy is abstract. Your playbook is complex. But a human story is universal. Storytelling turns your core principles into real-life experiences.

Whether you’re asking for budget or explaining a new drill, use the classic three-act structure:

  • The Challenge: “We were getting pushed around on the line every fourth quarter.”
  • The Process: “So we committed to this specific, grueling conditioning protocol.”
  • The Outcome: “By season’s end, we were the ones pushing in the final minutes.”

This structure provides context and shows cause and effect. It creates emotional resonance. You stop being just a source of instructions. You become a guide in a shared saga.

That’s how you move from being heard to being felt. It’s the difference between a parent nodding politely and seeing their kid’s future in your words. It’s the gap between an athlete memorizing a play and believing in a system.

Master this, and you’re not just coaching a sport. You’re curating an experience. The stats will be forgotten. The feeling of being part of a story? That lasts.

Body Language and Nonverbal Cues

Forget your carefully crafted speech for a moment—your audience is already reading the subtitles written in your posture. While you’re articulating strategy, they’re decoding your stance. As you emphasize a key point, they’re auditing your eye contact. Your body language is the unspoken testimony that either corroborates or contradicts every word you say.

Jenny Rearick hits the nail on the head with a brutally honest assessment: “If people are going to see my body language and hear my voice in the way I’m delivering this information, that’s going to impact how they perceive that information.” Think about that for a second. It’s not just what you say, but how your entire being says it. If your words claim “this play is critical” but your slouched shoulders whisper “I’m not convinced,” which message do you think the team believes?

The quote continues with the real payoff: “…if they perceive me as being grounded and competent and confident… they’re more likely to buy into the information I’m sharing.” This isn’t psychology jargon—it’s human nature 101. We trust congruent messengers. This is where body language becomes your most credible character witness in the courtroom of team communication.

In coach-athlete relationship theory, this aligns with “complementarity”—that synchronized, cooperative interaction where both parties are in sync. Your physical presence is your nonverbal complementarity with the room. Grounded feet signal stability. Open shoulders broadcast accessibility. Deliberate gestures emphasize conviction. Each element works together like players executing a practiced drill.

Let’s break down specific elements of effective body language for coaches:

  • Stance as Foundation: Plant your feet shoulder-width apart. This isn’t about military rigidity—it’s about communicating that you’re not going anywhere. You’re present, invested, and rooted in this moment.
  • Eye Contact as Connection: Scan the room like you’re checking in with each player during a timeout. Make it a firm handshake of the eyes, not a laser beam stare-down. Distribute your attention democratically.
  • Gestures as Punctuation: Use your hands to emphasize key points like an orchestra conductor highlighting a crescendo. Keep gestures at chest level—too high looks frantic, too low looks uncertain.

Now consider the flip side. Pacing signals anxiety—it’s the physical manifestation of “I want to be anywhere but here.” Crossed arms build a literal barrier between you and your team. Downcast eyes communicate submission or evasion. Your body language either amplifies or undermines your authority with every minute you speak.

Think of it as the nonverbal scouting report your team compiles in real-time. Are you a reliable leader or a shaky prospect? Your physical presence files the evidence continuously. Before you polish that perfect metaphor, practice standing and making eye contact. Practice your body language with the same diligence you’d apply to designing a game-winning play.

Confidence on stage doesn’t come only from preparation—it also depends on how effectively a coach communicates verbally. Learning the principles of mastering your coaching voice helps ensure that your message carries authority, clarity, and motivation when addressing the team

Handling Q&A

The Q&A session is like a jazz improvisation after a ballet. It’s where most coaches find they can’t dance. This is when your presentation turns into an unscripted reality show. The ice breaks, and the script ends.

This is where you show you’re not just reading lines. You actually know your stuff.

Don’t treat your talk like a monologue to memorize. A scripted speaker is like someone reading a movie description without letting friends ask questions. When a question comes, it feels like a hostile interruption.

The solution isn’t more memorization. It’s the opposite. Be “conversant.” This means being deeply familiar with your material. You can discuss it freely.

Think of it as the difference between an actor and an expert being interviewed. One is rigid, the other is responsive.

This conversant approach turns Q&A into your greatest opportunity. It’s like an athlete adapting in real time. You’re not defending your script. You’re engaging with curious minds.

A question isn’t an attack on your narrative. It’s an invitation to explore a new angle of your topic.

Your goal changes from delivering information to managing a conversation. This requires active listening. You can pivot and connect a question to your central message.

What happens when you don’t know the answer? This is the true test. The bluffer panics and invents something shaky. The sage understands that “I don’t know” can be powerful.

Try saying: “That’s an excellent question, and it’s one I need to look into more deeply.” Or: “My expertise is in X, but for Y, I’d recommend consulting Z.” This honesty builds trust.

The Q&A is where you prove command of your topic and respect for your audience. It’s where the lecturer becomes a genuine communicator. It’s where you show you can think, not just recite.

For a sports coach, this dialogue is where strategy meets personality. It’s where philosophy gets tested by practical curiosity.

Remember: The audience isn’t judging you on perfection. They’re evaluating your engagement. A messy but authentic conversation often beats a flawless but robotic speech.

The Q&A is your chance to transform from a talking head into a thinking partner. That’s where real coaching connections are made.

Workshop Exercises

The film room teaches theory, but the field demands execution. Turn your speaking tips into muscle memory. You can diagram a perfect play all day, but if your team can’t run it, what’s the point? Communication skills work the same way.

Let’s get off the whiteboard and onto the practice field. Here’s your workout plan for building vocal endurance and precision.

Start with “low-risk scrimmages.” Source 2 hits the nail on the head: start where the stakes feel minor. Volunteer for that five-minute equipment update in the next staff meeting. Explain the new hydration protocol to a small group of freshmen.

This isn’t about delivering a TED Talk; it’s about getting comfortable with your voice. The audience is friendly, the topic is straightforward, but the neurological reps are absolutely real.

Second, institutionalize the practice. If you lead a staff, create a “Presentation Rotation.” Each coach, GA, or intern presents on a relevant topic once a month. You’re not just building individual skill; you’re constructing a culture of communication.

A vibrant workshop setting focused on public speaking exercises for sports coaches. In the foreground, a diverse group of three coaches, dressed in professional business attire, are engaged in an interactive speaking exercise, practicing gestures and expressions. One coach stands confidently, demonstrating a technique, while the others observe attentively, taking notes. In the middle ground, a large whiteboard features organized notes with points on effective communication and body language, enhancing the educational atmosphere. The background includes sports equipment and motivational posters related to coaching and teamwork, creating an inspiring environment. The lighting is bright and warm, casting a welcoming glow throughout the room, evoking a mood of enthusiasm and collaboration. The scene is captured from a slightly elevated angle to encompass the entire workshop dynamic.

Third, and this is non-negotiable: practice out loud. Source 3 emphasizes this for good reason. Your office, your car, walking the dog—these are your private training grounds. Hearing the awkward phrase, feeling the stumble, timing the flow… this is your skill-specific conditioning.

Reading silently in your head is like visualizing a jump shot without ever touching a ball. The muscle memory forms in the vocal cords, the diaphragm, the pacing of your breath.

Customize your practice. This is where generic advice fails. If your primary fear is forgetting your points, practice with minimal notes. If it’s the judgmental gaze, practice first for one trusted colleague. If you rush, use a metronome app.

Tailor your drills to your specific weaknesses, just as you would design a conditioning program for a player returning from injury.

These exercises bridge the gap between knowing and doing. They move you from conscious incompetence—”I know what I should do”—to unconscious competence, where the right words and cadence simply flow. Stop waiting for the “big speech” to test your skills. Create the practice, demand the reps, and watch your confidence solidify with every low-risk scrimmage you conquer.

Success Stories

Let’s get real. You want proof, not just words. You want to see the real change from being nervous to being confident.

The NSCA is a great example. A graduate assistant starts with a small talk in a side room. But after years of practice, they’re speaking to a huge crowd. It’s not magic; it’s hard work and skill.

This shows us how it works: start small, seek brutal feedback, iterate relentlessly, and scale deliberately. Maybe your success story is about getting funding for new equipment. Or maybe it’s about getting more recruits because of better storytelling.

These stories are not just nice to hear. They show real results. Investing in public speaking makes you a better leader and team player.

To understand success, let’s look at what makes a coach great.

Coach Profile Starting Point Key Skill Developed Tangible Outcome Time to Result
Graduate Assistant (Strength & Conditioning) Nervous presenter at regional clinic Structuring concise, data-driven talks Promoted to lead presenter at national Coaches Conference 3 seasons
Head Soccer Coach Struggled to connect with recruits during home visits Authentic storytelling & relatability Increased top-tier recruit commitments by 22% 1 recruiting cycle
Program Director Failed to secure admin funding for new facilities Persuasive pitching & handling tough Q&A Secured $250,000 equipment grant after revised presentation 6 months
Assistant Basketball Coach Team tuning out during halftime talks Commanding body language & vocal projection Measurable improvement in 3rd-quarter team performance metrics 1 season

The table shows a pattern. Success isn’t about being a superstar right away. It’s about finding one area to improve and working on it. The strength coach focused on structure, and the soccer coach worked on storytelling.

These stories build trust in your program. When one coach does well, it makes others’ training seem smart. You’re not just making a better speaker. You’re making a better leader and a more persuasive advocate.

The real proof is in the pipeline. The NSCA promotes people to main stages because they deliver. Your success story is waiting in your next meeting or conversation. Start collecting your data points.

Confidence Boosting Routines

Confidence isn’t something you’re born with. It’s something you build through routines, like stretching before a workout. The difference between a shaky presentation and a strong one often comes down to the rituals you perform before speaking.

Think of it like athletes warming up before a game. They do specific routines to get ready. Your mind needs similar cues. This is where confidence building starts.

Let’s talk about what happens in your mind. Researchers call it “Cognitive Restructuring,” or arguing with your own negative thoughts. You know that voice saying, “I’m going to bomb this” or “They won’t listen”? That’s the opponent you need to outsmart.

Replace “I’m not ready” with “I am prepared to share valuable information.” Swap “They’ll think I’m a fraud” for “I have expertise worth hearing.” This isn’t just positive thinking. It’s mental technique practice. You’re rewiring your brain through repetition.

Now, let’s add physical rituals. Create a pre-speech routine as deliberate as your pre-lift mobility work. Here’s a simple framework that works:

  • 5-minute visualization: Close your eyes and mentally run through your talk. See yourself speaking clearly, making eye contact, handling questions smoothly.
  • Breathe and Release sequence: Three deep diaphragmatic breaths, holding for four counts, exhaling for six. Shake out your hands and shoulders.
  • Vocal warm-up: Hum scales softly, articulate tongue twisters, or simply read your first paragraph aloud at conversational volume.

This ritual signals to your nervous system that it’s “go time” in a controlled, familiar way. It transforms anxiety into anticipatory energy. The consistency is what builds real, reliable confidence over time.

Now for the meta part. When you execute these rituals and present with grounded confidence, you’re providing what psychologists call “perceived support” to your audience. Whether they’re athletes or executives, they perceive you as competent and reliable. That perception becomes a direct conduit to their confidence—in you, in your message, in the team’s direction.

Your confidence building routine, is never just about you. It’s the first rep in a chain of trust-building. You model poise, which gives others permission to feel secure. The research is clear: a coach’s confident communication directly mediates athlete self-confidence. The same principle applies to any leadership context.

Technique What It Is Best For Time Required
Cognitive Restructuring Identifying and replacing negative self-talk with evidence-based affirmations Overcoming pre-speech anxiety and self-doubt 3-5 minutes daily
Guided Visualization Mentally rehearsing successful performance from start to finish Building familiarity with material and reducing surprise anxiety 5-10 minutes before speaking
Physiological Anchoring Creating a consistent physical routine (breathing, movement) that triggers calm focus Managing adrenaline spikes and grounding yourself in the moment 2-3 minutes pre-event
Power Posture Practice Adopting expansive, open body positions to boost testosterone and reduce cortisol Projecting authority and actually feeling more confident chemically 2 minutes before entering the room
Verbal Priming Speaking key phrases or your opening lines aloud to activate language centers Reducing verbal stumbling and creating fluency from the first word 1-2 minutes before starting

The table above isn’t a menu where you pick one. It’s a circuit. Do them in sequence. The cumulative effect is what transforms nervous energy into commanding presence. Each technique addresses a different aspect of the confidence building puzzle—mental, physical, chemical, verbal.

Remember the golden rule of rituals: they must be personal but consistent. Your pre-game playlist, your lucky socks, your specific breathing pattern—these aren’t superstitions. They’re neurological triggers that tell your brain, “We’ve done this before. We know how this goes.”

Start small. Pick one technique from the table and practice it before your next team talk or meeting. Notice the shift. Then add another. Within weeks, you’ll have a personalized confidence building arsenal that works whether you’re addressing five people or five hundred. The routine becomes the foundation. The confident delivery follows naturally.

Conclusion

Your playbook is complete. We started with nerves and ended with routines. Moving from the tactical to the strategic, we’ve covered a lot. Public speaking for coaches isn’t about becoming Tony Robbins.

It’s about becoming a more potent version of yourself. This is important on the court, in the locker room, and during presentations. You’re not just teaching plays. You’re architecting belief.

Every speech, every team talk, every media interview is an exercise in perceived support. It’s how you translate drills into dreams. This shift from just getting by to genuinely getting ahead is the real career game-changer.

The microphone is your new whistle. The podium is your new sideline. Your voice, now understood as your most critical coaching tool, awaits its next drill. Go make the call.