All posts by Gladys Lee

Claude Can Rewrite Your Google Slides Now—The Hard Part Is Knowing Which Edits to Trust

Anthropic has moved Claude from the other side of the copy-and-paste workflow directly into Google Slides. The Claude Google Slides integration, announced October 6, can create and modify presentation content inside Workspace, turning AI from an outside drafting tool into an active participant in the deck itself.

That sounds like a productivity upgrade, but the bigger change is editorial. Once an AI assistant can rewrite titles, split slides, restyle content, and alter a presentation in place, the presenter’s job increasingly becomes deciding which changes deserve to survive.

Claude Google Slides Integration Moves AI Into the Working File

Anthropic’s Google Workspace announcement introduced two related workflows. A Workspace add-on places Claude in a sidebar beside an open Docs, Sheets, or Slides file, while separate connectors can let users create or edit Google files while working from Claude.

Inside Slides, Claude can use a deck’s existing layouts and themes when creating new slides. Anthropic also says it can identify problems such as overlapping elements, objects extending beyond slide boundaries, and difficult-to-read text.

That is considerably different from asking an AI chatbot to produce an outline and manually transferring the result into a presentation.

The assistant now works against the actual artifact. It can see the selected slides and make changes where the presentation already lives. That removes friction, but it also makes an AI mistake easier to turn into a finished-looking mistake.

Convenience shortens the distance between suggestion and publication.

Approval Controls Matter More Than the Generation Feature

Anthropic has made the default behavior relatively cautious. In “Ask before edits” mode, Claude describes a proposed change and waits for approval. Users can instead select “Accept all edits,” allowing ordinary content changes to proceed without repeated confirmation.

Those choices may look like workflow preferences, but they represent two very different editing models.

The first treats AI as an assistant whose work receives human review. The second moves closer to delegation.

For an early draft, broad delegation may be reasonable. A presenter could ask Claude to shorten titles, normalize formatting, or divide an overloaded section. On a nearly finished investor, executive, academic, or client deck, the risk changes. Small edits can alter claims, remove qualifications, change emphasis, or weaken the relationship between a visual and the argument it supports.

A useful rule is simple: automation should decrease as consequence increases.

Deck stageSuitable AI involvementHuman review priority
Early outlineHighStructure and missing information
First slide draftHighAccuracy and narrative flow
Design refinementModerateHierarchy, spacing, visual consistency
Stakeholder reviewLimitedClaims, numbers, wording and context
Final presentationVery limitedEvery audience-facing change

The fastest workflow is not necessarily accepting everything. It is applying automation where mistakes remain inexpensive to catch.

Protecting the Layout Requires More Than Matching the Theme

Claude’s ability to create slides from existing layouts and themes can help reduce one familiar AI-presentation problem: new slides that look disconnected from the rest of the deck.

Yet visual consistency is not the same as visual judgment.

A slide can use the correct font, colors, and template while still becoming harder to understand. An AI rewrite might expand a title enough to upset hierarchy, convert a concise point into several bullets, or preserve every piece of information when the slide actually needs subtraction.

That distinction matters because good presentations are designed around attention, not merely formatting rules. Techniques for preventing crowded presentation slides still apply even when an assistant can automatically detect some layout problems.

Reviewers should therefore ask more than “Does the new slide fit?”

They should ask what viewers notice first, whether the evidence still supports the headline, whether labels remain legible, and whether the slide is trying to perform too many jobs.

Template compliance cannot replace hierarchy.

AI-Rewritten Slides Still Need a Fact Check

Presentation editing becomes more consequential when Claude changes substance rather than appearance.

A request such as “make this slide more concise” sounds harmless. But shortening a sentence can remove a qualification. Rewriting an analytical title can turn an observation into a stronger causal claim. Summarizing several data points can imply a pattern the underlying evidence does not support.

That means fact-checking should follow the edit, not merely the research stage.

Anthropic’s Workspace usage guidance says edits appear in Google’s version history, giving users a way to inspect changes or restore an earlier version. That safety net is useful, but version history tells you what changed, not whether the new claim is correct.

For data-heavy decks, numbers should be compared with their original source. For quotations, dates, rankings, forecasts, and technical claims, the edited wording should be rechecked against the evidence.

The polished appearance of a revised slide should never become a proxy for factual reliability.

The Presenter Becomes an Editor of Decisions

AI presentation tools are often evaluated by how quickly they can generate slides. Direct editing changes the more interesting metric: how efficiently they can participate in revision without weakening the deck.

That puts more value on editorial judgment.

A competent reviewer needs to identify whether a proposed change improves meaning or merely changes wording. They must notice when consistency becomes repetition, when simplification becomes distortion, and when a visually attractive revision quietly damages the logic between slides.

This could change team reviews as well. Instead of spending meeting time fixing capitalization, formatting, or obvious density problems, teams may be able to push those mechanical edits to AI and spend more time debating the argument.

The opportunity is not eliminating human review. It is moving human attention toward higher-value decisions.

Watch the Boundary Between Assistance and Silent Revision

The next pressure point will be how comfortable users become with autonomous editing.

Anthropic’s beta already offers a choice between approving changes and allowing ordinary edits to proceed automatically. As tools improve, the temptation will be to grant them wider authority, especially for repetitive decks, weekly reports, sales presentations, and recurring internal updates.

That makes review discipline increasingly important.

Teams should decide which changes AI can make freely, which require inspection, and which should remain human-only. Numbers, legal language, customer commitments, strategic recommendations, and externally sourced claims deserve a much higher threshold than spacing adjustments or title capitalization.

Presentation teams will also need to watch current beta limitations. For example, Claude-created charts in Slides can be inserted as images rather than linked Sheets charts, meaning a source-data change does not automatically update the generated visual. That creates another place where apparently finished material can become stale.

Better AI Editing Makes Human Judgment More Valuable

The Claude Google Slides integration makes a meaningful shift because AI no longer has to stop at producing text that someone later transfers into a deck. It can now participate directly in the file where presentation decisions are made.

That can remove tedious work and make iteration faster. It also makes weak review more expensive because an inaccurate rewrite, diluted message, or poorly judged layout can move from suggestion to finished slide with very little friction.

The strongest presentation workflow will therefore not be the one that gives AI the most control. It will be the one that knows precisely where automation helps—and where a human still needs to say no.

Frequently asked questions

Can Claude directly edit an existing Google Slides presentation?

Yes. In the current beta, Claude can work through a Google Workspace sidebar, read the open presentation and selected slides, and make changes directly within the file rather than requiring manual copy-and-paste.

Can you review Claude’s edits before they are applied?

Yes. “Ask before edits” is the default mode and requires approval before changes are made. Users can also choose “Accept all edits” for ordinary edits, although certain sensitive actions still require confirmation.

Does Claude automatically keep generated charts updated?

Not necessarily. Anthropic says charts Claude creates in Google Slides are inserted as images rather than linked Sheets charts, so they do not automatically refresh when underlying spreadsheet data changes.

24‑Hour Post‑Game Review: Objective Film Session and Action Plan

What makes a team truly great? It’s not just about talent. It’s the deep reflection that happens right after the game. Coaches and players dive into the game film within 24 hours. This strategy is now a key tactic for business leaders too.

This isn’t just a casual talk. An objective postgame film session replaces emotional criticism with a clear process. It focuses on the actual game, breaking down office silos and creating a shared reality.

The benefits are clear. Structured coaching leads to fast team growth, with a high ROI. A quick review shifts the focus from blame to learning. It builds a culture of improvement and keeps team morale high.

By adopting this 24-hour review, you can turn any project into a learning experience. It’s a must-have for leaders who aim to succeed.

Purpose: learn fast, protect culture

Film sessions without a clear purpose can turn into unproductive gatherings. They can actually hinder progress instead of helping it. A good 24-hour post-game review has two key goals. It aims to speed up learning and keep the team culture strong and healthy.

The “learn fast” goal is about quick feedback. Insights from the game should lead to immediate actions for the next practice or game. This stops small mistakes from becoming big problems. Sadly, in many places, only 26% of reps get weekly coaching. A timely review can close this gap quickly.

The second goal, “protect culture,” is just as important. The review must focus on the system, not personal attacks. This way, errors are seen as problems to solve, not personal failures. It builds trust and keeps the team positive, with a healthy feedback ratio—similar to how strong communities like Levante cultural associations maintain identity and cohesion through shared values and constructive dialogue.

On the other hand, “group cringe watch” sessions can be harmful. They often lead to silence, fear, and blame. A purposeful review aims to “measure reality” and unite the team. It kills silence and fear, turning meetings into active problem-solving sessions.

By setting these goals from the start, leaders create a process that builds trust and engagement. The feedback ratio of praise to correction is carefully managed. This ensures the team grows in a supportive environment, where their culture is valued.

Structure: 1) acknowledgment, 2) 5 good reps, 3) 5 growth reps, 4) data snapshot, 5) individual clips, 6) next‑practice

A six-phase review transforms post-game film sessions into focused learning. This structure ensures all aspects are covered while keeping the meeting on track. It prevents the meeting from becoming a chaotic debate that wastes time and confuses priorities.

The template fits within a 60-minute window. Each phase has a specific goal. This mirrors the “daily play” concept used by top software teams, where experiencing the product together makes priorities clear.

Phase Key Action Time Guide Primary Outcome
1. Acknowledgment Open by recognizing collective effort 5 minutes Sets a positive, psychologically safe tone
2. 5 Good Reps Review specific positive executions 15 minutes Reinforces strengths and successful patterns
3. 5 Growth Reps Identify critical learning opportunities 15 minutes Pinpoints areas for immediate improvement
4. Data Snapshot Present 2-3 key performance metrics 5 minutes Provides objective context for film review
5. Individual Clips Analyze short, teachable clips 15 minutes Delivers personalized, actionable feedback
6. Next-Practice Define written action commitments 5 minutes Translates insight into a concrete plan

Phase 1: Acknowledgment. Start by recognizing the team’s hard work and spirit. This isn’t about false praise. It’s about validating effort to create an environment where people are open to critique. It sets the stage for a productive, blame-free conversation.

Phase 2: 5 Good Reps. Systematically review five specific plays where execution was excellent. Name the players involved and describe what made the rep successful. This practice builds confidence and makes winning behaviors repeatable. It ensures the review isn’t solely deficit-focused.

Phase 3: 5 Growth Reps. Next, examine five moments with clear room for improvement. The term “growth rep” depersonalizes the error. Frame these as opportunities, not failures. The focus is on reviewing specific “coachable moments” instead of the full game tape, saving time and sharpening focus.

Phase 4: Data Snapshot. Introduce 2-3 key statistics that tell the game’s story. This could be turnover margin, rebound differential, or completion percentage. The data provides an objective anchor. It prevents the film session from being swayed by subjective memory or emotion.

Phase 5: Individual Teachable Clips. This is the core of skill development. Select very short video segments—under seven seconds each—that isolate a single coaching point. These teachable clips are powerful because they are visual, specific, and memorable. Use telestration tools to draw on the screen, highlighting positioning or movement. The goal is to create “aha” moments for individual players.

Phase 6: Next-Practice Plan. Conclude by translating all insights into written commitments for the next training session. What drills will we run? Which personal KPIs will each player focus on? This written plan, derived from the teachable clips and growth reps, creates accountability. It turns discussion into action.

This six-phase blueprint turns a mandatory film session into a catalyst for rapid improvement. By moving from acknowledgment to a concrete plan, you cover all bases efficiently. The structure keeps the conversation on track and ensures everyone leaves with clear direction.

Ratio and tone: 3:1 praise to correction; depersonalize errors

Imagine a review where every correction is cushioned by three specific pieces of praise. This isn’t just feel-good management; it’s a strategic feedback ratio proven to accelerate learning and safeguard your team’s culture. The 3:1 praise-to-correction balance is your framework for ensuring players leave the film session motivated to improve, not defeated by their mistakes.

A professional feedback ratio chart illustrating a 3:1 balance between positive feedback and corrective suggestions. In the foreground, a detailed bar graph shows vibrant green bars for positive feedback towering over softer orange bars for corrective feedback, symbolizing a supportive review environment. In the middle ground, an abstract gradient background transitions from light to dark blue, evoking a sense of calm professionalism. The lighting highlights the bars, creating a slight glow effect, emphasizing the contrast between praise and correction. The atmosphere is one of constructive evaluation and team growth, with no text or captions present. The composition is clean, focusing solely on the feedback ratio concept, perfect for conveying an objective and balanced approach to performance assessment.

Why does a 3:1 feedback ratio work? Psychologically, it builds a foundation of safety and competence. When an athlete knows their strengths are seen and valued, they become infinitely more receptive to hearing about their weaknesses. This ratio keeps the defensive walls down and the learning pathways open. It transforms the session from a critique into a collaborative problem-solving meeting.

The magic, though, isn’t just in the math. It’s in the tone. The second pillar—depersonalizing errors—is non-negotiable. Mistakes must be framed as decisions and actions to adjust, not as personal flaws. This separates the player’s identity from the performance error, protecting their confidence and directing focus to solutions.

How do you depersonalize feedback in practice? Use these language techniques:

  • Focus on the Action, Not the Actor: Instead of “You missed that block,” say “That blocking technique broke down here. Let’s look at the foot placement.”
  • Use the System as the Reference Point: “Our coverage rule on that play is X. The read took us away from that rule.” This makes it about the process, not the person.
  • Ask Forward-Looking Questions: Use the film as evidence and ask, “How would you handle that read differently next time?” This is far more productive than asking “Why did you do that?”
  • Label it as Data: Refer to mistakes as “learning data” or “growth reps.” This clinical framing reduces emotional sting and reinforces a growth mindset.

This approach directly serves the core purpose of protecting your culture. When errors are depersonalized, players are not afraid to have their film shown. They start to see the review session as a valuable source of intel, not an inquisition. The feedback ratio ensures the environment remains constructive, where the goal is collective improvement, not assigning blame.

Mastering this balance of abundant praise and objective correction turns your 24-hour review into a powerful culture-building ritual. It ensures you are developing resilient, coachable athletes who view every game—win or lose—as a rich source of actionable intelligence.

Clip selection rules: <7 sec, single coaching point, telestration layers

Just like a bug in a play session is exposed raw for everyone, a well-chosen film clip makes a coaching point clear. In a play session, a bad merge is a problem for all. Film review should be just as clear.

The goal is to focus on specific coachable moments, not full plays. This makes review a powerful teaching tool.

Follow these three rules to build your library of effective teachable clips.

The “

Keep every clip under seven seconds. This rule forces players to focus. Attention is limited, and short clips keep minds sharp. Long clips let players get distracted or overthink.

By keeping clips short, everyone focuses on the key moment.

The “Single Coaching Point” Principle

Each clip should show only one correctable action. Avoid clips with multiple errors. Too many corrections confuse players.

Isolating one point makes the lesson clear and actionable. This turns a generic clip into a focused teachable clip.

Master Telestration Layers

Use drawing tools to highlight the action. Telestration layers guide the team’s eyes to the mistake. Arrows, circles, and lines make the action clear.

Visual tools are not just for film. Coaches can improve team communication with visual aids. Clarity through focused imagery is key.

Selection Rule Primary Purpose Outcome for the Player
Enforce hyper-focus and eliminate distractions. Instant comprehension, no mental drift.
Single Coaching Point Simplify the correction and avoid cognitive overload. Clear, actionable takeaway for immediate improvement.
Telestration Layers Visually isolate and highlight the exact teachable moment. Undeniable visual proof of the concept being taught.

When these rules work together, film sessions become more efficient. You teach “what needs to change” instead of just showing “what happened.” Every second of review time is an investment in player growth.

This method turns raw footage into a curriculum of teachable clips that drive growth.

Assignments: personal KPIs, drills, rehab notes

Turning game-day insights into daily improvement needs a clear plan. This step makes the review practical. It changes “what we saw” into “what you will do.”

Written plans are key to success. Studies show they boost task completion by 67%. Verbal feedback often fades. A written plan keeps everyone on track.

Your goal is to create a personalized roadmap with each athlete. This roadmap includes three main parts: Key Performance Indicators (KPIs), drills, and rehab notes.

Personal KPIs: The Measurable Targets

KPIs turn film session insights into clear goals. Instead of “be more aggressive,” aim for “increase on-ball steals from 1 to 3 per game.” Good KPIs are specific, measurable, and directly tied to growth areas.

Match KPIs to the player’s type. A veteran might focus on leadership, like directing defensive rotations. A rookie’s KPI could be basic, like reducing unforced turnovers.

Targeted Drills: The Practice Blueprint

Drills bridge the gap between identifying a skill gap and improving it. Design drills that focus on the specific skill needing work. For example, if footwork is a growth area, include a 10-minute daily footwork ladder routine.

Give clear instructions and video demos if possible. The drill should be something the player can do alone before the next practice.

Rehab Notes: Correcting Ingrained Habits

Some mistakes are deep-seated habits. These need “rehab notes.” Think of them as a mental or technical flaw fix. A note might say: “Before every catch, consciously plant your outside foot.”

Rehab notes are short, cue-based reminders. They help change muscle memory through focused repetition.

A detailed and organized workspace depicting a "personalized player development plan" as the central focus. In the foreground, an open notebook lies on a polished wooden desk, filled with handwritten notes about personal KPIs, drills, and rehab notes. A sleek laptop shows graphs and performance metrics. In the middle, a whiteboard filled with color-coded strategies and timelines is visible, showcasing a collaborative plan. The background features shelves lined with sports equipment and books on athlete training. Soft, natural light streams in through a window, creating a warm and motivating atmosphere. The scene is captured from a slightly elevated angle to emphasize the layout. The overall mood is focused and professional, conducive to serious development and improvement.

To make this work, assignments must be tailored. A one-size-fits-all approach fails. Use the following framework to guide your personalized plans.

Player Archetype Primary KPI Focus Sample Drill Rehab Note Strategy
Veteran Leader Communication & Efficiency Film study on opponent tendencies; lead a pre-game walkthrough. “Vocalize the screen direction on every defensive switch.”
Developing Rookie Fundamental Execution Ball-handling drills with a defensive gauntlet; 200 extra shots. “Eyes up on the dribble, scan the court on the third bounce.”
Injury Comeback / Habit Rehab Confidence & Mechanics Graduated contact drills; slow-motion form repetition. “Trust your plant leg; follow through to the target on every rep.”

The last step is athlete ownership. The player should help write their plan. This makes the plan personal, not just a coach’s order. It ensures the 24-hour review fuels real growth.

A dynamic player development plan is a living document. Update it after each game review. This cycle of assessment and action makes good teams great, and good players exceptional.

Parent/stakeholder recap variant

The post-game review framework goes beyond the locker room. It becomes a key way to talk to parents, sponsors, and other stakeholders. This outside look at progress shows how far the team has come.

Change the main points for this group. Highlight the main lessons and how the team has grown. Include a quick look at the data that shows the team’s progress. This helps everyone see the team’s growth and keeps supporters on board.

Be open but also keep the team’s culture safe. Talk about fixing systems, not blaming people. This shows the team is moving forward in a positive way.

A brief, organized summary can turn a private review into a tool for building relationships. It shows you’re always trying to get better and keeps important people involved in the team’s journey.

Whiteboards & Live Drawing: Keep Athletes Engaged and On Task

Welcome, coach! Let’s talk about a powerful tool for teaching. It’s probably in your locker room or office.

Film sessions can be messy. Play diagrams are all over different notebooks. It’s hard for athletes to see the whole strategy.

Visual teaching is your secret weapon. The simple act of live diagramming can change how your team learns and remembers.

About 65% of people learn better when they can see it. This is why using “hyper-visuals” grabs and holds an athlete’s attention.

Modern tools, like interactive smart boards, bring everything together. They mix film breakdown, game planning, and team communication into one space. It’s like building a real-time playbook for everyone to follow.

In this guide, we’ll go beyond just drawing X’s and O’s. You’ll learn to make your board an interactive command center. This keeps every player focused, on task, and ready to execute the game plan with confidence.

When to Go Analog: urgency, space limits, quick iterations

Let’s explore three key game-day moments where dry-erase systems shine. Digital tools are great for planning, but knowing when to switch to analog is essential for coaches.

First, think about urgency. Picture a tense timeout where you must make a critical adjustment quickly. Digital tools can slow you down. A traditional whiteboard is instant. Grab a marker and start drawing. This speed helps everyone understand the plan fast.

Next, consider space limits. In tight spots like crowded sidelines or small locker rooms, everyone needs to see the plan. Analog boards are perfect here. They let your team gather around one spot, making it easy to see the strategy.

Physical boards also create a central point for your team. They’re ideal for those last-minute huddle tactics before a big play.

Lastly, analog is great for quick iterations. Need to brainstorm a new set piece or tweak a play? Erasing and redrawing quickly lets you try different ideas fast. You can sketch out five new concepts in the time it takes to open a digital file. It’s all about rapid, unfiltered thinking.

It’s not about old-school versus new-school. It’s about picking the right tool for the task. Your dry-erase systems provide a direct way to communicate with your athletes. Sometimes, the simplest way to get your ideas across is with a quick marker stroke.

Board Setup: zones, color code key, magnets/number chips

Think of your board setup as the blueprint before building the house—it dictates how well everything fits together. A little prep here saves you from a confusing mess later and makes your play install process smooth and effective.

Start by dividing your whiteboard into logical zones. This creates a clean, organized workspace that guides the eye. Most coaches find three zones work best.

The largest zone is for your main diagram. This is where you’ll draw the play. Next, reserve a smaller section for a key or legend. The final zone is for quick notes and adjustments. Having dedicated spaces prevents your brilliant play from getting lost in a sea of scribbles!

Now, let’s talk about your secret weapon for clarity: color coding. This isn’t about making things pretty. It’s about making connections instantly transparent. Our brains process color faster than text or monochrome lines.

Establish a simple color code key and stick to it. For example, use blue for offensive routes and red for defensive assignments. Make green the color for the primary option or the ball carrier. Put this key in your legend zone so everyone is on the same page.

This consistent color coding turns a complex diagram into an easy-to-read story. Players see a green route and immediately know, “That’s my first look.” It aids understanding dramatically.

To build your diagram quickly, begin with a custom field template. You can draw a basic court or field outline before the session. This gives you a consistent starting point for every play install.

Bring your board to life with magnets or number chips. These are game-changers! Use them to represent players. Now you can move a defender to show a coverage adjustment or slide an offensive player to demonstrate a new route—all without erasing a thing.

It transforms your static drawing into an interactive model. You can walk through “what-if” scenarios on the fly. This dynamic element keeps athletes engaged and makes learning stick.

Common Whiteboard Zones and Their Purposes
Zone Name Primary Function Recommended Tools Pro Tip
Main Diagram Area Drawing the full play or concept. Dry-erase markers, field template. Use the center 70% of the board.
Legend/Key Section Holding your color code and symbols. Fine-tip markers. Keep it in the top corner for easy reference.
Notes & Adjustments Jotting down player reminders or variations. Different colored marker. Use this space for last-minute coaching points.
Player Movement Zone Placing and moving magnets/chips. Numbered magnets, colored chips. Use contrasting colors from your main diagram.

By investing a few minutes in this intentional board setup, you’re not just drawing. You’re building a clear visual system. Your athletes will decode and internalize information much faster, making every teaching moment count.

Live Drawing Flow: announce goal, draw slowly, confirm cues, rehearse

Have you ever seen a coach scribble fast on a board while players ignore them? The solution is a careful live drawing flow. This method turns simple X’s and O’s into a memorable lesson. It’s not about showing off; it’s about guiding your team’s eyes and minds through a concept step by step, which aligns with principles of effective visual learning from memorable lesson.

The best live diagramming sessions follow a clear, four-step rhythm: Announce the Goal, Draw Slowly, Confirm Cues, and Rehearse Immediately. This structure grabs attention from the start and lets athletes learn at their own pace.

A dynamic scene showcasing a live diagramming flow on a whiteboard in a training environment. In the foreground, a professional coach in smart casual attire, focused and engaged, is slowly sketching diagrams with colorful markers. The middle ground features athletes attentively watching and interacting with the coach, some nodding in understanding, while others point at specific cues on the whiteboard. The background shows a bright, modern training facility with large windows letting in natural light, enhancing the collaborative atmosphere. The scene conveys focus, engagement, and energy, with a slight depth of field effect to emphasize the coach and athletes. The lighting is warm and inviting, creating a motivating environment for learning and teamwork.

Step 1: Announce the Goal. Before you start drawing, tell your athletes exactly what you’re going to show. Say, “We’re going to diagram our out-of-bounds play against man-to-man pressure.” This sets a clear focus. It answers the “why are we looking at this?” question and prepares their brains to learn.

Step 2: Draw Slowly and Narrate. Your hand speed should match the speed of learning. As you draw, talk through it: “The PG uses a screen here, forcing the defender to choose a path.” This syncs the visual with your voice. Drawing slowly prevents “spaghetti lines” and gives everyone time to process. It turns the drawing into a story you’re telling together.

Step 3: Confirm Cues with Questions. Don’t assume they get it—check! Pause and ask direct, simple questions. “Jamal, what’s the center’s first look after the entry pass?” This turns passive viewing into an active quiz. It confirms understanding in real-time and lets you correct misunderstandings before they stick. This interactive step is key for engaging tactics at any level.

Step 4: Rehearse Immediately. The drawing is meaningless if it stays on the board. The final, critical step is to immediately rehearse the concept. Have players point to the board and verbalize their role: “I cut to this corner.” Even better, walk through it on the court right away. This bridges the gap between theory and action, cementing the live diagramming lesson into muscle memory.

Step Coach’s Action Player Outcome
Announce State the specific concept to be drawn. Focus is directed; mental preparation begins.
Draw Slowly Illustrate step-by-step while narrating each move. Visual and auditory learning sync; complexity is broken down.
Confirm Cues Pause to ask targeted, comprehension-check questions. Active participation replaces passive watching; misunderstandings are corrected.
Rehearse Facilitate immediate verbal or physical practice of the drawn concept. Knowledge transfers from board to action; retention skyrockets.

When you lock into this flow, your whiteboard stops being just a tool and becomes a stage for collaborative learning. You move from talking at your team to thinking with them. This proven drawing flow ensures that your brilliant strategy doesn’t get lost in a mess of lines, but instead becomes a crystal-clear plan your team can execute with confidence.

Player Roles: captains mirror on mini-boards, backups restate assignments

Think of your team huddle as a crew, each member with a task. The best coaches use huddle tactics to teach effectively. They assign roles to make learning active and player-led.

This method tackles a modern challenge: athletes often review info on their devices. We can bring that personal touch to the huddle. Let’s look at two key roles you can assign.

Choose team captains or unit leaders for a special task. As you draw the main drill on the whiteboard, they mirror it on their mini-boards. A clipboard with a whiteboard works great.

This does more than just copy lines. It makes leaders process info actively as they draw. They become assistant coaches, teaching their group. This boosts engagement as they’re invested in teaching right.

The Backup’s Job: Restate the Assignment

After explaining a player’s role, turn to their backup. Ask them to repeat the instructions in their words. For example, “So, my job is to clog the lane and then box out the weak-side forward.”

This huddle tactic is powerful. It checks if the backup player understands and reinforces the main player’s instruction. It ensures everyone is clear, not just nodding.

Here’s a quick comparison of these core player roles to help you implement them:

Role Primary Task Tool / Method Key Outcome
Captain / Leader Mirror the coach’s diagram in real-time Personal mini-board or clipboard Creates leaders, ensures small-group understanding, promotes active processing
Backup Player Restate a teammate’s assignment aloud Verbal paraphrase in own words Confirms personal understanding, reinforces instruction for others, boosts accountability
Coach (You!) Facilitate and guide the process Main whiteboard and role delegation Multiplies teaching impact, fosters collaborative learning environment, increases retention

By using these roles, you change the huddle’s dynamic. It becomes a collaborative workshop. Everyone is involved. This method is key to modern huddle tactics, leading to better understanding and retention.

For more strategies on engaging your athletes visually, explore our guide on essential visual aids for coaching success, from handouts to interactive tech.

Combine with Film: freeze-frame → whiteboard redraw → walk-through

When you mix video with live drawing, it’s like adding a heartbeat to your playbook. Film study alone can be dull. Whiteboard sessions can be abstract. But together, they create a powerful learning tool that makes play install real for your athletes.

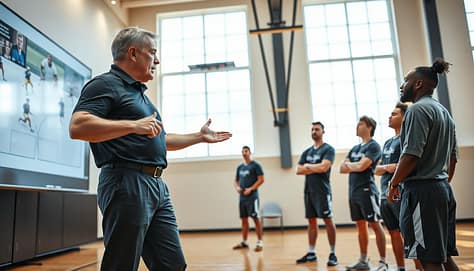
A professional sports coach stands in a well-lit gym, passionately analyzing a freeze-frame of a key play on a large screen. In the foreground, the coach, dressed in a smart polo shirt and tailored athletic pants, gestures towards a digital whiteboard filled with strategic diagrams and player positions. The middle ground features attentive athletes, dressed in polished practice gear, actively engaging with the play being discussed. In the background, large windows let in natural light, adding an energetic vibe to the scene. The camera angle captures the coach’s focused expression, emphasizing the collaboration and enthusiasm of the training session. The atmosphere is dynamic and focused, showcasing a blend of technology and traditional teaching methods in sports coaching.

This isn’t about fancy tech. It’s a simple, three-step process that turns watching into doing. You can slow down video with a tablet app or just pause it on a big screen. The goal is to make what players see into what they must do.

Let’s break down the process. It works for any situation, from a brilliant set piece to fixing a defensive lapse.

The Film-to-Field Learning Loop

This method connects three types of memory: visual, cognitive, and physical. It makes film sessions actionable and whiteboard lessons relevant.

Step Primary Tool Coaching Focus
1. Freeze-Frame Game Film / Tablet App Identifying the critical moment: spacing, positioning, and decision point.
2. Whiteboard Redraw Dry-Erase Board & Markers Translating dynamic video into a static, analyzable diagram for group discussion.
3. Walk-Through Court/Field & Players Physical replication of the diagram to build muscle memory and confirm understanding.

Step 1: Freeze-Frame the “Why”

Don’t just watch film—find a teachable moment. Pause it. This is your classroom snapshot. Apps let you draw on the video, but a big screen works too.

Ask your team: “What do you see here?” Highlight the key spacing between defenders. Point out the angle of a cutter. This moment is your lesson’s foundation.

Step 2: Whiteboard Redraw for Clarity

Now, move from the screen to the board. Redraw that moment exactly. Trace the player positions. Sketch the movement lines. Use your color-coded system.

The board makes the complex simple. Angles become clear. Gaps become obvious. You’re not just talking about the play; you’re building a shared mental model of it. This is where deep play install begins.

Step 3: Walk-Through to Lock It In

Get up! Have your team stand on the court or field. Use your whiteboard diagram as their map. “Joe, you are this X here. Maria, you are this circle.” Position them exactly as on the board.

Then, run the play from that moment forward. This connects the cognitive map to physical movement. It turns theory into feel. The walk-through confirms they understand their assignments. It also reveals misunderstandings instantly—before the next game!

This Film → Board → Field loop creates a complete learning experience. Athletes see it, diagram it, and then do it. This holistic approach makes complex strategies stick. It transforms film review from a passive watch-along into an active play install workshop. Your team won’t just know the play; they’ll understand the “why” behind every move.

Common Errors: spaghetti lines, tiny labels, no legend

Clarity is your whiteboard’s superpower, but common errors can turn it into a source of team-wide confusion. Let’s troubleshoot the most frequent slip-ups that sabotage even the best dry-erase systems. By spotting these habits early, you can fix them and keep your visual teaching crystal clear.

The first culprit is what we call Spaghetti Lines. This happens when you draw a tangled web of arrows, loops, and paths. It looks busy and becomes impossible for players to follow. The fix is simple: use single, decisive lines. One clear path beats a dozen messy ones every time.

Next up are Tiny Labels. If you’re scribbling notes only you can read from up close, you’ve lost the room. Remember, a player in the back needs to see it too. Write big, bold, and legible from every sightline. If it’s important enough to write down, it’s important enough to see.

Perhaps the most common mistake is having No Legend. Never assume everyone remembers that your blue circle is the quarterback or a squiggly line means a screen block. This assumption creates instant confusion. Always include a simple key. Just a small corner with “QB = Blue Circle” makes all the difference.

  • Color Overload: Stick to your color code. Using every marker in the pack just makes a rainbow mess.
  • Drawing for Yourself: Always check sightlines. Crouch down to a player’s view to make sure your diagram isn’t blocked.
  • Erasing Too Fast: Give everyone time to process. That mental picture needs a moment to develop before you wipe it away.

Mastering your board means avoiding these common traps. When you use clear lines, bold writing, and a consistent legend, your dry-erase system becomes a reliable tool for learning, not a puzzle to solve. Keep it simple, keep it big, and keep everyone on the same page.

Maintenance: cleaning, spare markers, travel boards

Your whiteboard is as important as your playbook or whistle. It needs regular care to stay in top condition. This care keeps your tool working well every time.

Start with regular cleaning. Use a whiteboard cleaner, not harsh chemicals. This stops ghosting and keeps your board looking new. Your drawings stay clear for athletes to follow.

Don’t forget to carry spare markers. Have different colors ready and check they’re not dry. A dead marker can mess up your coaching flow. Being prepared keeps your sessions smooth.

For coaches on the move, portable travel boards are key. Brands like Vibe Board make sturdy, light options. They fit in your bag for quick sessions anywhere.

By taking care of your whiteboard, you’re always ready to coach. You can teach clearly and effectively anywhere. A well-maintained tool keeps your athletes focused and ready for anything.

Google Meet Is Now Saving Screenshots of Your Slides—That Changes What “Presentation-Ready” Means

Google Meet presentation screenshots are turning slide decks into something more permanent than a live visual aid. When Gemini’s “Take notes for me” is active, presented slides, charts, diagrams, and related material can be captured into the meeting-notes document, so a slide may be revisited long after the speaker stops explaining it.

That raises the standard for a presentation-ready deck. A slide that works with narration can fail when someone encounters it later as a static image with only surrounding notes for context.

Google Meet presentation screenshots turn slides into meeting records

Google began the visual screenshot rollout on August 3, 2026. The feature is intended to preserve visual context that a transcript can miss, especially when a speaker refers to a chart, diagram, or slide without describing every detail aloud.

Current screenshot settings guidance adds a practical detail: screenshots can include presentation-like resources, and presented content must remain on screen for at least 10 seconds to be included. Participants are notified when screenshots may be captured, and screenshot settings can be managed depending on account and administrator controls.

The change is subtle but consequential. Presenters used to design mainly for the room or video call. Now they also need to consider the meeting artifact created afterward, where slides can be detached from pacing, gestures, cursor movements, and verbal explanation.

A Slide Can No Longer Depend Entirely on the Presenter

Many effective live presentations use sparse slides. A chart appears while the speaker explains the anomaly. A photograph fills the screen while the presenter supplies meaning. A slide titled “The Problem” works because everyone heard the previous two minutes.

As a screenshot, the same slide can become ambiguous.

The answer is not to overload every slide with text. It is to add enough standalone context that the main point survives without a narrator. If a colleague opened only this slide tomorrow, could they identify the subject, understand what they are seeing, and explain the intended takeaway?

That often means replacing headings such as “Results” or “Next Steps” with message-driven titles. “Customer Churn Fell After the June Onboarding Change” carries meaning when separated from the presenter. “Results” does not.

Design for the Screenshot, Not Only the Screen

Screenshot-aware design favors clarity over dependence on live explanation. Titles should state the point. Labels should identify important numbers. Units and time periods should be visible. Acronyms need enough context to remain intelligible later.

The table shows how common slide choices behave when they leave the live presentation and enter meeting notes.

Slide elementWorks liveRisk as a screenshotBetter approach
Generic headingPresenter supplies meaningContext disappearsUse a message-driven title
Unlabeled chartSpeaker explains axesData becomes unclearLabel units, periods, and key series
Full-screen imageNarration creates meaningImage may look arbitraryAdd a short contextual caption
Dense process diagramPresenter guides attentionViewer may not know where to lookEmphasize the key path or stage
Animated buildMeaning appears step by stepCapture may show one stateMake each visible state understandable

The goal is self-contained clarity, not self-contained completeness. Slides still need restraint. The viewer simply should not have to reconstruct missing narration to understand why a slide mattered.

Charts and Diagrams Need Their Own Explanatory Layer

Charts are especially vulnerable because presenters often rely on pointing or spoken interpretation. “Look at the spike here” works in real time. In a saved image, “here” has disappeared.

A stronger chart identifies its conclusion visually and verbally. Use a title that states the finding, direct labels on important series, or a short annotation marking the event that changed the trend. Decorative legends matter less than making the main comparison immediately legible.

The same principle applies to process diagrams, timelines, and embedded media. If a deck uses video, good video clip presentation practices matter because a captured frame may not communicate the full sequence or purpose of the clip.

Privacy and Presentation Timing Become Design Decisions

The workflow also creates a governance question. A presenter may briefly show a discussion-only slide, reveal an internal dashboard while switching windows, or display a sensitive visual that should not become part of a persistent meeting document.

Google gives administrators controls over when visual screenshots are allowed, while users are notified when screenshot capture is active and can manage it from the notes panel. Those controls reduce risk, but they do not replace presentation discipline.

Teams should decide before the meeting which slides are safe to preserve and which materials should remain outside the shared deck. Presentation hygiene now includes retention awareness.

Timing matters too. Because Google says content must remain presented for at least 10 seconds to be included, presenters should not treat the feature as a perfect archive. Fast transitions or brief references may not appear. Meeting notes are a selective record, not a guaranteed copy of every visual shown.

presentation screenshot privacy

Three Signals Will Shape Screenshot-Aware Deck Design

The pressure point is whether presentation design catches up with a workplace where decks increasingly become recordings, AI summaries, screenshots, and reference documents.

Watch how often teams rely on AI notes instead of reopening the original deck, whether screenshot capture expands across more meeting workflows, and how organizations handle sensitive visual material. Those shifts will determine how aggressively teams redesign templates for post-meeting use.

The strongest decks will still feel clean and focused in the room. They will simply carry enough portable meaning to remain useful afterward.

Google Meet presentation screenshots make that distinction harder to ignore. A presentation-ready slide is no longer just one that looks good while someone is speaking; it is one that still communicates when the speaker, pointer, and live context are gone.

Frequently asked questions

Does Google Meet automatically screenshot every presentation slide?

No. Screenshot capture is tied to “Take notes for me” and applicable account and administrator settings. Google also says presented content must remain visible for at least 10 seconds before a screenshot can be included.

Can presenters tell when Google Meet may capture screenshots?

Yes. Google Meet displays a notification informing participants that Gemini may improve meeting notes with screenshots when the feature is active, giving presenters visibility into how presented material may be preserved.

Should slides contain more text because of Google Meet screenshots?

Not necessarily. The better approach is adding enough context through descriptive headings, labels, annotations, and clearly identified data rather than turning every presentation slide into a text-heavy document.

What kinds of presentation visuals can appear in Google Meet notes?

Google says screenshots may capture presentation-like content such as slides, charts, diagrams, and other visual material shared during a meeting when screenshot capture is enabled.

How should presenters design slides for AI-generated meeting notes?

Slides should use clear titles, readable labels, visible units, concise annotations, and enough context to make the main message understandable even when someone views the slide without hearing the original presentation.

Infographics for Coaches: Turn Stats into Scouting Clarity

After every game, you face a huge pile of data. This includes passes, duels, shots, and tackles. It’s easy to get lost in spreadsheets and numbers.

But, the magic happens when you make this data easy to see. A good sports data infographic is like a translator. It turns hard stats into simple images. These images help your team quickly understand what needs to change to win.

This method uncovers key insights. You’ll see how well your team performs, how they convert chances, and their tactical moves. Suddenly, the whole game becomes a clear path for getting better.

In this guide, we’ll show you the whole process. You’ll learn to ask the right questions, pick the best charts, and share your findings. We’ll use examples like analyzing a midfielder’s pass success or showing a team’s pressing tactics.

Let’s make those confusing numbers work for you.

Define the Question: “What do we want them to do differently?”

Turn raw stats into coaching wisdom by focusing on one simple question. What behavior needs to change?

Before you start designing, the real magic happens in your mind. The best sports infographics aren’t just about looks. They answer a focused question that guides field decisions.

Imagine you have 90 minutes of match data. Counting passes or shots is simple. But does it tell players what to do differently? Probably not.

Our community shows that analysis should look at more than just passes. It should check the “progressive value.” It should compare expected goals (xG) to actual results. It should also measure tactical actions, like recoveries in the final third for a high-press plan.

So, how do you begin? Ask yourself: “What do we want our players, scouts, or coaches to do differently after seeing this?” Your answer will guide your design.

If you want them to understand why possession didn’t win games, ask about “Performance Efficiency.” Focus on the value of each pass. If finishing is the issue, center your question on “Conversion of Chances,” comparing xG to reality.

By defining this question first, you’ll know which KPIs to track. This focus turns a generic report into a targeted KPI dashboard that guides action. It tells you whether to adjust a drill, scout a new player, or change a game plan.

Remember, great sports infographics start with a ‘why,’ not a ‘what.’ Define the question, and you’ve already won half the battle.

Choose the Right Chart: location maps, timelines, bars vs slopes, percent tiles

Think of your data as ingredients; the right chart is the recipe that turns them into a meal your coaching staff can digest. You’ve defined your sharp scouting question. Now, you need a visual tool that answers it with instant clarity. Picking the wrong one creates confusion, but the perfect match makes your insight undeniable.

Let’s break down the go-to options. We’ll match each chart type to the specific question it answers best.

For spatial analysis, you need to see where things happen on the field or court. A location map or a shot chart is your best friend here. Want to show your striker’s favorite shooting zones or expose a soft spot in your defensive shape? A shot chart with simple dots for attempts and goals tells that story in seconds.

To show intensity or concentration, use a heat map. This visual is fantastic for displaying a player’s movement density, zones of high pressing activity, or areas where your team dominates possession. A heat map uses color gradients to make patterns pop, moving beyond simple location to show “how much” activity occurs there.

For trends over time, like tracking a player’s form across a season, you have two great choices. A simple timeline with data points works. But to really emphasize change and progression, use a slope chart. This chart connects key data points with a line, making the upward or downward trajectory impossible to miss. It’s more dynamic than a series of isolated bars.

When you need to compare players or units, turn to the classic bar chart. It’s the undisputed champion for side-by-side comparisons. Whether you’re comparing scoring averages between forwards or defensive stops between lineups, bars give a quick, clear visual ranking.

Lastly, for showing where a player ranks (e.g., “in the 85th percentile for progressive passes”), use percentiles or gauge charts. These visuals instantly communicate performance relative to a league or team standard. They answer the question, “How good is this, really?” at a single glance.

Remember, the goal is always clarity, not complexity. The best chart is the one that makes your players and staff say, “I see it now.” Your visuals should communicate strengths and weaknesses so clearly that the next action step feels obvious.

A detailed basketball shot chart heat map, vividly showcasing various shooting locations on a basketball court. The foreground includes a vibrant, color-coded representation of shot accuracy, with warmer colors indicating higher success rates and cooler tones showing lower performance areas. In the middle, the court is highlighted with accurate markings, including three-point lines, free-throw circles, and key zones, against a polished wooden floor texture. The background features subtle court-side details like bleachers and a scoreboard, softly blurred to ensure focus on the chart. The lighting is bright and clear, mimicking a well-lit gym environment, capturing a professional and analytical mood. The entire image is clean, clear, and devoid of any text, ensuring it conveys important scouting insights effectively.

Build a One-Pager: objective, 3 KPIs, 2 visuals, action notes

A player report card is more than a summary. It’s a guide that helps your team focus before practice. Busy coaches and executives need a quick, clear page. This one-pager turns complex stats into easy-to-understand insights. It’s your key to making sports data memorable and useful.

Let’s create your guide together. Every good one-pager has four main parts:

  • A Single Objective
  • Three Key KPIs
  • Two Core Visuals
  • Action Notes

Start with your one Objective at the top. Be clear and direct. Is it “Assess midfield control in the last game” or “Evaluate defensive transition speed”? This helps avoid getting lost in data.

Then, pick three KPIs that measure your objective. For example, if you’re focusing on midfield control, your KPIs could be Progressive Passes Completed, Final Third Recoveries, and Passes into the Penalty Area. These numbers tell the main story.

Next, add two visuals to support your KPIs. A pass map and a bar chart comparing your player to league averages are good choices. Think of a player profile in a scouting template—clear and impactful.

The Action Notes section is key. It turns data into coaching. For instance, “Player X excels at breaking lines with passes but needs to improve defensive positioning in transition; focus on shadow play drills this week.”

When you put these parts together, you get more than a document. You get a single source of truth. This one-pager keeps everyone—coaches and players—on the same page. It’s your data center for the week.

Visual Cues: team colors sparingly, danger/green zones, icons for roles

Visual cues are like a secret language for heat maps. They guide your eyes to important details without words. When done right, your infographic becomes a silent helper on the field.

Color is key, but use it wisely. Don’t cover your heat map in team colors. Use primary and secondary colors for key data or to show team differences. This makes important info stand out.

Set up clear zones on your heat map. Use a red “danger zone” for high-risk areas and a green for safe ones. This system quickly shows risk and safety. A coach should see the problem areas clearly without needing to read numbers.

Use icons instead of long text labels. A glove for goalkeepers, a boot for strikers, or a whistle for coaches is quicker to understand. This makes reviewing player progress fast and easy.

These visual cues—using color, zones, and icons—make stats clear. They turn a busy graphic into a tool for quick decisions. Your heat map is more than data; it’s a guide to the game’s key moments.

A detailed soccer heat map focusing on danger zones across a soccer field. In the foreground, overlay vibrant green and red gradients to signify safe and dangerous areas, respectively. In the middle, include icons representing player roles such as defenders, midfielders, and forwards, depicted using minimal team colors to maintain clarity. The background should be a stylized soccer field with a well-defined grid pattern. Use soft, diffused lighting to emphasize the zones, and apply a slight vignette effect for depth. Capture the atmosphere of strategic analysis and coaching insight, ensuring the overall look is professional and informative without any text or distractions.

Common Traps: rainbow heatmaps, dual Y-axes, tiny labels

Let’s look at the common mistakes that can make a great stat hard to understand. Even with the best data, some design traps can hide your insights. We’ve all been there—excited to share a finding, only to have the team squint at the chart in confusion.

Your goal is to make sports infographics and statistics clear and easy to read. Avoiding these three common errors will help you achieve this.

  • The Rainbow Heatmap Trap: It’s tempting to use every color in the toolbox. A vibrant, rainbow-colored heatmap might look exciting at first glance. But it often creates a confusing spectacle where high and low values blur together. Think of it like trying to find a specific player in a crowd where everyone is wearing a different jersey color.

The solution is simplicity. Use a single-color gradient, like light blue to dark blue for intensity. Or, use a clear two-tone system like red (low) to green (high). This creates an intuitive visual scale the brain can process instantly.

  • The Dual Y-Axis Confusion: Plotting two different metrics on one chart seems efficient. For example, showing distance covered and pass accuracy over time. But it forces the viewer to reconcile two separate scales at once. It’s like trying to listen to two different songs simultaneously—you can’t focus on either.

Instead, use two separate, aligned charts placed side-by-side. This allows for clean comparison without the mental gymnastics. Your players and coaches will thank you for the clarity.

  • The Tiny Label Problem: Never sacrifice legibility for space. Tiny fonts or labels are a major engagement killer. Remember, your infographic might be viewed on a phone screen in a dim locker room or printed on a board from a distance.

If people have to squint, they’ll disengage. Always prioritize large, clear text. It’s better to have one less data point than a point nobody can read. Your visual should communicate, not complicate.

By steering clear of these traps, you transform raw numbers into scouting clarity. Great data visualization in sports isn’t about fancy tricks. It’s about removing every possible barrier to understanding.

Workflow: collect → clean → sketch → test on 2 players → finalize

Think of your data visualization workflow like a coach’s playbook. It’s consistent, repeatable, and designed for success every time. Jumping straight into design software is a common mistake. Instead, a structured process ensures your final infographic is both clear and actionable.

This five-stage workflow mirrors the disciplined approach of a top scout. They establish criteria, identify targets, conduct assessments, and analyze reports. Your visual creation should follow a similar path from raw data to polished insight.

  1. Collect Your Raw Data

Gather everything from your tracking systems, video analysis software, and old-fashioned stat sheets. Don’t be selective yet; cast a wide net. This stage is about accumulation, ensuring you have all the pieces on the table before you start building the puzzle.

  1. Clean and Filter for Your KPI Dashboard

Here’s where you turn noise into signal. Filter out irrelevant events, correct any errors, and, most importantly, structure the data around your 2-3 key performance indicators. For example, if you’re analyzing build-up play, you might isolate completed passes only in the attacking third. This clean dataset is what will power your KPI dashboard and become the foundation of your visual story.

  1. Sketch the Layout on Paper

Resist the computer! Grab a notepad or whiteboard and map out where each element will go. Where does the headline sit? Which chart is the hero? How will the action notes flow? This quick sketch saves hours of digital trial-and-error and forces you to prioritize the message over cosmetic details.

This is your non-negotiable reality check. Show your draft to two players or assistant coaches. Can they grasp the main point in 10 seconds? Do they misinterpret a color or get confused by a chart label? Their fresh eyes will catch what you’ve become blind to. This feedback is pure gold for refining your approach to making sports data memorable.

  1. Finalize the Design

Incorporate the feedback from your test audience. Adjust colors for better contrast, clarify labels, and simplify any complex elements. This is where you polish the final product, ensuring your KPI dashboard or scouting report is ready for the locker room or strategy session.

Adopting this workflow might feel slower at first, but it guarantees a higher-quality output and saves immense time on revisions. You’re not just making a pretty picture; you’re engineering a tool for better decisions.

Print vs Screen: DPI, margins, light/dark modes

Before you finalize that coaching infographic, think about where it will be seen. Will it be on paper or a screen? The same sports infographics and statistics need different settings for paper and pixels. This ensures your message is clear, whether it’s on a poster or a player’s phone.

Preparing for print or screen is like planning for two different games. The strategy changes based on the field conditions. By optimizing for each medium, you make sure your data-driven insights are always ready.

For print, like handouts or posters, resolution is key. You need a sharp image that won’t get blurry when enlarged. Always export your files at at least 300 DPI (dots per inch) for professional printing. This keeps every detail clear.

Also, remember the printer’s limits. Most can’t print right up to the edge of the paper. Leave enough space on all sides and keep important info away from the edges. Losing a stat to a paper trim is a missed chance!


Optimizing for Digital Viewing

For screens, like tablets or phones, the rules change. Screen resolution can be lower (72-150 DPI is fine). Your new challenge is making it comfortable and adaptable.

First, consider the light. A bright white background can be too harsh in a dark room. Always test your visuals in different lighting. A dark background or softer colors can help players focus during film study.

Second, think about size. Text and icons need to be big enough for small screens. If players can’t read the numbers on their devices, the infographic fails to communicate sports infographics and statistics clearly.

Here’s a quick reference table to keep the key specs straight:

Consideration Print (Poster/Handout) Screen (Tablet/Phone)
Resolution (DPI) 300 DPI or higher 72-150 DPI is sufficient
Critical Design Rule Use wide, safe margins Test light & dark modes
Text & Label Size Visible from a distance Legible on small screens
Export Format PDF for sharp vectors JPG or PNG for quick sharing

Your Final Export Checklist

Modern tools make this process easy. Whether you’re using Google Slides, PowerPoint, or design software, you can save in multiple formats. Export a high-DPI PDF or JPG for print. Save a separate version for digital use.

By taking these final steps, your hard work will pay off. Your sports infographics and statistics will have maximum impact, wherever your team sees them. Now, let’s look at some templates to put all this knowledge into practice!

Template Kit: game summary, opponent scout, player progress card

You don’t need to start from scratch for every report. A template kit is like a visual playbook. It saves time and makes sure everyone uses the same language.

Start with a Game Summary template. It should have spots for the final score and three key stats. You can also include a possession flow chart and a shot map. Don’t forget space for post-match thoughts.

Then, create an Opponent Scout template. This sheet helps you understand your next opponent. It should have sections for their formation, key player tendencies, and set-piece strategies.

Lastly, make a Player Progress Card template. This card tracks a player’s growth over a season. Use graphs for their key metrics and add coach notes. A good player report card tells a story of growth with data.

Using professional templates means everyone speaks the same visual language. You spend less time on design and more on analysis. Your documents become powerful tools for your team.

15-Minute Pre‑Game Presentation: Slide‑by‑Slide Blueprint

The moments before a big game or project launch are key. What you say and how you say it can shape the team’s focus and success. A strong pregame talk is more than just a briefing. It’s a chance to boost confidence and clear goals.

Studies show that a 15-minute limit can focus minds and keep them engaged. Using a countdown timer helps keep everyone on track. This turns a regular meeting into a focused, impactful session.

This article offers a detailed guide for leaders and coaches. We’ll cover a proven structure for your slides, based on lesson plan basics for clear planning. You’ll learn how to move from random notes to a well-organized presentation. You’ll also discover ways to engage your audience and make your message stick.

Pre‑Game Deck Blueprint

Think of your pre-game deck as a strategic blueprint, not just a slideshow. It’s a powerful tool that aligns your team’s performance. A well-structured game plan deck is the single source of truth before action starts.

This blueprint organizes your strategic timeline and assigns tasks. Like a business presentation, your deck needs a professional design. It keeps the team focused and informed from the start—much like global collaborative art projects, where every contributor follows a shared vision to create something cohesive and impactful.

The key is to shift from passive to active communication. Your deck becomes the operational manual for everyone. This change makes preparation a collaborative effort.

Why does this approach work? It brings clarity and avoids confusion before the game starts. A solid game plan deck blueprint includes several key parts:

  • Clear Objectives: States the primary goals everyone must understand.
  • Defined Roles: Outlines specific assignments and responsibilities for each team member.
  • Key Strategies: Highlights the main tactical approaches for success.
  • Visual Priorities: Uses icons and color codes for instant recognition.

Each part has a specific role in building team confidence. The objective slide sets the direction. The roles slide ensures accountability. The strategy slides provide the plan to execute.

Your pre-game deck blueprint is the foundation of your preparation. It aligns the team’s mindset and coordinates their efforts. Investing time in this game plan deck architecture leads to synchronized effort and victory.

Goals: clarity, confidence, calm

Every minute of your pre-game talk should focus on three main goals: clarity, confidence, and calm. These are essential for a successful briefing. Imagine you’re a teacher getting students ready for a big exam. Your deck is like the lesson plan, making sure everyone understands and feels prepared.

This trio works together. Clarity removes mental clutter, builds confidence, and leads to calm under pressure. You can’t have one without the others. A confused team is anxious. A team doubting the plan will hesitate.

Let’s look at each goal, starting with clarity. This means removing all confusion from roles, tactics, and expectations. Using special teams slides is a great way to do this. A single slide for the kickoff unit gives clear, specific instructions.

A group of diverse professionals in business attire gathered around a large presentation screen, displaying slides labeled "Goals: Clarity, Confidence, Calm." In the foreground, a confident presenter gestures towards the slides, exuding enthusiasm and leadership. In the middle, attentive team members observe, taking notes, displaying expressions of focus and interest. The background features a modern conference room with large windows letting in soft natural light, creating a warm and inviting atmosphere. Use a wide-angle lens perspective to capture the collaborative spirit and engagement of the scene. The overall mood is one of determination and positivity, reflecting a successful pre-game presentation environment.

Confidence comes from clarity. It’s the unshakable belief in thorough preparation and understanding the plan. In business, a clear project template builds confidence. The same is true in sports. A detailed plan for each unit builds confidence in players.

Lastly, calm is the result. It’s the state you achieve when everything is structured. A predictable briefing process reduces anxiety. Players feel secure, knowing what’s coming next.

The following table shows how these three goals work together. It outlines their impact, a key tactical example, and your role as the leader:

Goal Psychological Impact Operational Tactic Coach’s/Teacher’s Role
Clarity Eliminates doubt and mental friction. Using focused special teams slides for unit-specific instruction. Provide explicit, unambiguous direction. Act as the definitive source of truth.
Confidence Builds belief in the plan and self-efficacy. Showing how each unit’s task ladders up to the win condition. Demonstrate thorough preparation. Connect individual roles to collective success.
Calm Reduces anxiety and fosters poised readiness. Following a structured, predictable presentation flow every time. Model composed authority. Create a reliable, low-stress briefing environment.

Mastering these three goals makes your pre-game talk powerful. You’re not just telling your team what to do. You’re shaping their mindset for performance.

Slide Flow (12–15 min): 1) Tone-Setter, 2) Three Keys, 3) Opponent Tendencies, 4) Matchups/Assignments, 5) Specials/ATO

Think of your slide deck as a countdown timer. Each segment must lock in a critical piece of the game plan before the clock runs out. A logical, timed flow is what separates a forgettable talk from a focused mission brief.

Just like a project manager runs a meeting with a strict agenda, your pre-game presentation needs a minute-by-minute blueprint. This structure ensures you cover everything without rushing. It builds comprehension and urgency in your team.

Here is the optimal five-slide sequence designed to fit within 12 to 15 minutes:

  1. The Tone-Setter (Minutes 0-2)

Open with a punch. Use a powerful image, a short hype video clip, or a compelling quote. This isn’t filler. It’s a hook that grabs attention and sets the emotional state.

Data shows that starting with a thought-provoking question or statistic increases audience engagement by over 40%. Make this moment visceral. It transitions the team from the locker room chatter to your strategic world.

  1. The Three Keys (Minutes 2-5)

Now, distill your entire strategy into three core pillars. These are your non-negotiable focus points for the game. Clarity is king here.

Use simple language and strong visuals. For example: “Dominate the glass,” “Protect the paint,” “Value every possession.” Limiting it to three ensures the message is memorable and actionable.

  1. Opponent Tendencies (Minutes 5-8)

Present data-driven insights with razor-sharp clarity. Don’t show raw stats. Show patterns. Use icons or simple charts to highlight how the opponent scores, their favorite plays, and their defensive weaknesses.

This slide answers the “why” behind your three keys. It turns strategy from an opinion into an evidence-based plan. Keep it concise; you’re providing intelligence, not a scouting report.

  1. Matchups/Assignments (Minutes 8-11)

This is where accountability is built. Clearly define individual roles and matchups. Who is guarding their star player? What is our switching protocol on screens?

Use a simple table or graphic to pair defenders with assignments. This visual clarity eliminates confusion in the heat of the moment. Everyone leaves the room knowing their primary job and their backup responsibility.

End with your contingency plans. Review 2-3 critical set plays for out-of-bounds situations or after a timeout. This is your ace in the hole.

Briefly walk through the primary option and the counter if the defense takes it away. This final slide instills confidence. The team knows you have prepared answers for key moments.

To visualize this timed flow, consider this structured breakdown:

Slide Time Allocated Core Purpose Engagement Tip
Tone-Setter 2 min Capture attention & set emotion Use a provocative image or video
Three Keys 3 min Establish strategic pillars Limit to three, use bold icons
Opponent Tendencies 3 min Provide data-driven intelligence Show patterns, not just numbers
Matchups/Assignments 3 min Clarify individual accountability Use a clear visual pairing chart
Specials/ATO 3 min Detail contingency set plays Walk through primary & counter option

This slide-by-slide blueprint ensures a smooth, logical journey. It moves your team from broad inspiration to specific, executable tasks. Sticking to this flow guarantees you cover all critical bases while respecting the precious pre-game clock.

The final minute acts as your buffer for questions or a final rallying cry. By mastering this sequence, you turn information into directed action, with every player clear on their roles and matchups.

Visuals: icons, traffic‑light priorities, wristband codes

Your team’s ability to absorb critical information under pressure depends on visual simplicity. Words alone can be overwhelming. Well-designed visuals help cut through the noise.

Icons serve as a universal language. Use simple symbols to replace paragraphs. A shield icon means “defensive focus.” A lightning bolt signals “fast break.” Consistent iconography helps your team recognize these symbols instantly.

A dynamic pre-game presentation scene set in a modern sports arena, featuring a large, high-tech presentation screen in the background displaying vibrant visuals, including icons and traffic-light priorities for different team strategies. Foreground elements include a diverse group of professionals in business attire, attentively analyzing wristband codes and presentation materials. The atmosphere is electric, filled with anticipation and excitement. Lighting is dramatic, with colorful spotlights illuminating the presenters and screens, while the audience is slightly blurred in the middle ground, creating a sense of focus on the visuals. The angle captures the energetic vibe of the event, highlighting the importance of visuals in a successful pre-game strategy.

Use a traffic-light priority system. Color is key for signaling urgency.

  • Red: Critical, non-negotiable points. “Stop everything and focus here.”
  • Amber/Yellow: Important reminders or key adjustments.
  • Green: Foundational principles or standard operating procedure.

This method lets players quickly know where to focus first.

Integrate wristband codes or quick-reference calls visually. Show the wristband graphic with the code highlighted. Use a simple table to match situations with calls:

Situation Wristband Code Visual Icon
Full-Court Press Red 5 🟥 + #5
Last-Second Shot Fist ✊
Defensive Switch Twist 🔄

This connects the meeting room to the court.

Start with a short hype video. It’s not just filler. A 45-60 second montage of your team’s best moments, set to powerful music, sets the tone. It builds energy, fosters unity, and primes emotional engagement before discussing strategy. It visually declares, “This is who we are.”

Follow professional design best practices. Use high-contrast colors. Dark backgrounds with light text work well in dim rooms. Choose a single, readable font like Arial or Helvetica. Keep font sizes large—no one should squint.

Every chart or diagram must be simple and high-quality. Complex graphs confuse. Clean visuals enlighten. The goal is to offload cognitive work from your players’ brains onto the screen. When your visuals do the heavy lifting, your voice can focus on delivery and emphasis.

These visual principles—icons, color codes, integrated references, and a strategic hype video—transform your blueprint into instant understanding. They ensure your knowledge is not just heard, but seen and remembered.

Delivery tips: pacing, eye contact, cold‑calls without shame, time buffer

A perfect pregame presentation template needs a great delivery. Your slides are just the start. It’s how you present that really matters.

Think of your delivery as the engine that drives the plan home. Follow these actionable techniques to communicate with authority and connection.

Control Your Pacing

Rushing through slides can confuse your team. A steady pace lets complex ideas sink in. Stick to your agenda but pause for emphasis. This ensures you cover all material without overwhelming your audience.

Use Eye Contact Strategically

Don’t talk to the screen or whiteboard. Look at your players. Make eye contact with everyone in the room. This builds trust and shows you’re engaged.

Embrace Cold‑Calls (Without the Shame)

Randomly ask a player to explain a key point. This isn’t to punish, but to engage. It keeps everyone alert and checks for understanding. Frame it positively: “Jay, walk us through the priority on their inbound play.”

Build in a Time Buffer

Never fill all 15 minutes. Always reserve a 2–3 minute cushion. This buffer is for urgent questions or clarifying details. A hard stop at 15 minutes feels rushed. Finishing at 12 minutes gives you room to adapt and reinforces calm.

To make your delivery stick, remember these core principles:

  • Set Clear Objectives: Before you start, know what you want the team to feel and know.
  • Use Storytelling: Weave in a quick analogy or past example to make a tactical point memorable.
  • Engage, Don’t Lecture: Use your voice, your eyes, and strategic questions to create a two-way street.
  • Practice Out Loud: Rehearse your talk with the timer running. It builds confidence and smooths out pacing.

Mastering these delivery tips ensures your well-crafted pregame presentation template translates into focused, confident action on the court. The final product isn’t the slide deck—it’s the team’s readiness.

Printable one‑pager for pockets

A coach’s pre-game message only matters if players can remember and act on it. That’s why a printable one-pager is essential. It turns your 15-minute speech into a physical item players can carry and refer to anytime.

This isn’t just another slide. It’s a tough, single sheet made for a pocket or waistband. It forces you to narrow down your game plan to the most important points. Players get a personal guide for the start of the game and every timeout.

So, what should be on this small guide? Stick to the basics:

  • Our Three Keys to Victory: The main strategies from your talk.
  • Top Opponent Tendencies: Their main actions in key moments.
  • Primary Matchups & Assignments: A quick reminder of who guards whom.
  • Wristband Codes for Specials/ATO: The names for your set plays.
  • Traffic-Light Priorities: Visual signs for must-do, should-do, and avoid actions.

The benefits are clear right away. Players get clarity and less mental clutter. They can focus on playing, not remembering. For coaches, it boosts accountability and provides a steady reference point. You can point to the sheet during a timeout instead of repeating yourself.

This one-pager is the last, tangible link between your strategy talk and the game. It makes sure your game plan is in your players’ hands, not just in their ears.

Checklist + template link

The printable one-pager makes your presentation easy to carry. Players can check key strategies before the game starts. Coaches can save the full presentation as a PDF or share a link via OneDrive. This way, everyone can access it from anywhere.

Here’s a quick checklist for your pre-game routine. It covers everything from the initial plan to your final presentation.

First, define your three main goals for clarity, confidence, and calm. Then, create a 12-15 minute presentation flow. This should include your tone, key messages, and insights on the opponent.

Use icons, traffic-light priorities, and wristband codes to make it visual. Plan how you’ll pace your delivery, make eye contact, and include cold-calls. Don’t forget to leave 2-3 minutes for questions.

Start with a professional template to make your pre-game prep faster. Our library has editable pregame presentation templates. They’re customizable and save you time. Download one today to apply what you’ve learned.

This system gives your team clear direction. A well-planned pre-game talk is key to success.

Slides to Enhance Team Communication: Best Practices for Sports Presentations

Let’s cut through the pre-game hype. We’ve all been in that team meeting where the strategy is on a dirty whiteboard. It’s been there forever.

Or imagine a PowerPoint slide full of text. It looks like a legal contract. In a world where winning is all about small details, why do we treat our slides like an afterthought?

This isn’t just about making slides look good. It’s about making a real impact. Your slide deck is like a silent assistant coach, a 24/7 recruiter, and a top stakeholder manager.

We’ll use insights from top platforms to make your slides powerful. Forget boring templates. We’re creating a mental playbook.

What Makes Communication Work?

Why do some team talks hit the mark, while others fall flat? It’s not just the data. It’s how you deliver it.

Think of a famous halftime speech. It’s not about stats. It’s a story that creates a shared identity and touches emotions deeply. Most sports communication slides fail to inspire. They confuse giving info with motivating.

Tools for sports presentations aim to engage and impress. Your talk should spark action, not just share facts. Showing a clip that makes your linebacker feel his mistake is more powerful than just telling him.

So, what makes a message hit home? Three key principles are at the heart of effective team messaging.

  • Clarity is Your Offensive Line. If your message is unclear, it won’t get through. Avoid jargon and focus on clear goals. Every slide and word should support your main idea.
  • Emotional Resonance is Your Home-Field Advantage. Data is important, but emotion drives action. Use shared pride and challenges to motivate. This is what makes strategies stick.
  • Visual Storytelling is Your Star Playmaker. Images are processed faster than text. A clear graph or metaphor can convey more than text. It’s a powerful tool in your presentation.

This combination turns a simple briefing into a strategic session. It’s how you build belief in your plan. Analyzing performance becomes a story of growth.

The best sports communication slides know this. They’re not just backgrounds for stats. They’re the stage for your story and the blueprint for action. Is your effective team messaging built on these principles, or are you just hoping it works?

Mastering this is what sets coaches apart. It turns a meeting into a war room and a team into a single unit.

Essential Slides: Goals, Roles, Schedules, Feedback

Let’s dive into the real stuff: the key slides for any team’s visual communication. You might have great ideas, but without the right slides, your strategy stays hidden. Think of your deck as your core team—these four slides are essential for any player meeting templates.

A modern office environment featuring a sleek conference room filled with essential presentation slides projected on a large screen. The foreground displays a close-up view of the presentation slides, clearly showcasing headers like "Goals," "Roles," "Schedules," and "Feedback." In the middle ground, a diverse group of professionals in business attire attentively discusses the slides, highlighting active engagement and teamwork. The background is adorned with a large whiteboard filled with teamwork strategies and brainstorming notes, while soft, natural lighting filters through large windows, creating a productive yet warm atmosphere. The camera angle is slightly tilted downward to focus on the slides and professionals, emphasizing the collaborative mood essential for effective communication in sports presentations.

Forget about decks with too much text. Professional sports templates show us that simplicity wins. Your presentation needs a clear goal, defined roles, a schedule, and a way to adjust plans. Without one, your strategy has a big weakness.

The North Star Slide is your first must-have. It’s not just a mission statement. It’s a visual guide. Instead of saying “Win the Conference,” show a championship ring with the season’s date. This slide should inspire your team to aim for greatness.

Next up, Role & Responsibility Cards. These make ownership clear and personal. Use slides that look like player profiles to show who’s doing what. This approach, seen in templates for “Competitive Players,” makes roles clear. For a professional look, use templates for roles and responsibilities.

The third essential slide is the Master Schedule. Don’t just paste a spreadsheet on a slide. Instead, use a timeline of major milestones. This visual helps everyone see how their tasks fit into the season’s story. It makes the hard work meaningful.

Lastly, the Feedback Loop Slide is often overlooked. It’s how you improve. You need a place to track what’s working and what’s not. Think of it like an “Employee Engagement Action Plan” for your team. Dedicate a slide to tracking morale, performance, and tactical changes. This turns your presentation into a living document that shows you’re listening.

Goals, Roles, Schedules, Feedback. These four slides are the foundation of any team’s strategy. Without them, your efforts are just practice without a game. Mastering these slides turns generic player meeting templates into a powerful tool for success.

Customizing Your Slides by Audience

Showing the same slides to everyone is like calling a flea flicker on fourth and inches—a big mistake. Your sports communication slides need to change like a chameleon. They must fit the audience, not just show off.

Knowing your audience is key. You need to understand what they care about. For coaches, it’s about the players. For marketers, it’s about sales and fans. Just as teams adapt their strategies based on opponents and game situations, presentation strategies should evolve depending on the audience. In the digital sports and esports space, tools such as multiplayer game hosting solutions demonstrate how technology can support collaboration, analysis, and interactive engagement during presentations or training sessions.

Industry leaders offer a great guide. They show what different people want from your presentation.

Audience Type Primary Focus (Planning) Strategic Need Implementation & Performance
Athletic Coaches Organizing training schedules Game plan development Evaluating player progress & film analysis
Sports Marketers Campaign timelines & budgets Target audience analysis Measuring campaign success & social media ROI
Event Coordinators Logistics and venue planning Enhancing fan experience Executing game-day operations smoothly
Team Administrators Budget allocation & resource planning Long-term organizational strategy Tracking financial and operational KPIs

Coaches focus on the details. Marketers look at the big picture. Your slides must change to fit this.

For players, show the raw film. Use clear metrics and feedback. For sponsors, talk about brand and impact. For the media, tell a story.

This isn’t just changing backgrounds. It’s a complete change in message for each audience. Your sports communication slides stay true but change how they’re shown. You become a master of communication, adapting to every audience.

When to Share (Pre/Post Game, Weekly Updates)

Think of your communication schedule like the play clock. Sharing your slide deck at the wrong time is like a penalty. Effective team messaging is about what and when you say it. The timing of your updates sets the pace for everything.

Top teams plan their updates with the same care as a playbook. Let’s look at the three main scenarios.

The pre-game strategy meeting deck is like a manifesto. It’s for alignment and getting everyone fired up. You don’t want to go deep into last month’s numbers here. Keep it short and bold, focusing on the opponent’s weakness and your key tactics. It gets everyone ready.

On the other hand, the post-game analysis deck is all about facts. It’s time to leave emotions behind. You’ll use data and video to analyze what went wrong. It helps separate facts from feelings.

A dynamic office environment showcasing diverse team members engaged in a strategic meeting. In the foreground, a middle-aged woman of Hispanic descent, dressed in professional attire, points to a digital calendar indicating pre-game and post-game schedules. Beside her, a young Black man in smart casual clothing takes notes on a laptop. In the middle, a large screen displays a timeline with colorful icons representing weekly updates and game-related communication. The background features a bright, sunlit room with a large window showcasing a view of a nearby sports field. Soft, warm lighting enhances a collaborative atmosphere, while a sleek conference table and modern chairs frame the scene. The overall mood is focused yet energetic, highlighting effective team messaging timing.

The weekly update is like the heartbeat of your team. It’s a status report, not a story. It’s like a detailed film study session. You’ll discuss injuries, new drills, and practice plans. It connects the emotional highs of game days.

So, how do pros manage their updates? Tuesday is for detailed analysis. Wednesday and Thursday’s practices build energy. Friday’s walk-through needs clear, motivational slides. Your timing is key.

Each slide has its purpose based on the timing. A data-heavy slide is out of place on Friday. Mastering the timing is essential. Your release schedule is the silent quarterback of your entire communication strategy.

Get the timing right, and you build momentum. It’s not just about sharing information.

Case Studies: Improved Team Engagement

Think of this as your ‘Moneyball’ moment for team communication. We’re moving from stories to real data.

The theory is solid. But does it work under pressure? Let’s look at the evidence.

The “Team Coach – Sports” testimonial is a great example. They found their presentations became “much more engaging” after switching to clean, visual player meeting templates. It wasn’t just about looking good. It was about grabbing attention.

The “Marketing Director” also used the same design for a product launch. The lesson? A well-designed slide can be used for more than one thing. It’s a tool for clarity.

The real value isn’t in a single success. It’s in the ongoing process. Imagine taking the corporate world’s “Developing Strategic Employee Engagement Action Plan” template. Now, make it simple and use it for your team.

Now, you’re not just tracking fitness. You’re tracking morale, recognition, and personal goals. That feeling that “the locker room feels off” becomes something you can address.

Let’s look at a hypothetical turnaround. A mid-tier college program had trouble with effort and communication. Morale was just okay.

Their solution? A consistent, visually engaging weekly check-in template. Every player had a dedicated slide segment in the team deck. It asked for a win, a struggle, and a personal goal for the week.

The magic wasn’t in the template itself. It was in the ritual. The coach presented the data each week. “Looks like several of you felt the conditioning drill was off. Let’s adjust.” Or, “Seven of you praised Johnson for extra film study. That’s our culture.”

The slide deck stopped being just a monologue tool. It became a way to start a dialogue. Players felt heard because they saw their input matter.

The results were more than just “happier players.” They were measurable.

  • Voluntary practice attendance increased by 22%.
  • Coaches saw a 35% rise in player-led tactical suggestions during film sessions.
  • Most importantly, on-field communication errors dropped in the next season.

The template gave structure. The team added heart. Together, they turned data into a dialogue-driven dynasty. That’s the power of moving from gut feelings to slide-worthy strategy.

Tips for Interactive Meetings

The clicker in your hand is not a remote control for your team’s brains. If your meeting feels like a one-man show, you’ve already fumbled the snap. The death of good communication isn’t bad data—it’s the monologue. Your goal is to turn that broadcast into a workshop.

This is where your sports communication slides evolve from a static playbook into an interactive sandbox. The source material gets it right: videos, animations, and hyperlinks are your engagement MVPs. But it’s not just about adding bells and whistles. It’s a mindset shift.

Start by weaponizing your video clips. Don’t just show the highlight reel. Embed the cringe-worthy mistake. Freeze the frame and ask, “What did we miss here?” Let the team dissect it in real time. That three-second clip sparks more debate than twenty slides of bullet points ever could.

Next, cater to your data nerds. Use hyperlinks liberally. That complex defensive statistic on slide five? Link it to a full dashboard. Let your assistant coach dive down the rabbit hole during the meeting. It keeps the curious engaged and shows you respect their depth of analysis.

For true effective team messaging, you need live feedback. Simple polling tools are a game-changer. Pose a direct question in your slide: “Raise your hand if you think we should foul in this situation.” Instant consensus. No more guessing what the room is thinking.

Structure your slides as provocations, not pronouncements.

  • Use a slide title that asks a question: “Is our zone press too predictable?”
  • Leave a blank area on a tactical diagram for the team to scribble solutions.
  • Start with a controversial statement and build the evidence together.

This transforms your presentation from a report into a conversation. The magic happens when someone gets up, touches the screen, and draws a new route. When two players argue over a diagram, they’re not being disruptive—they’re owning the strategy with you.

Your communication slides should feel incomplete without the team’s input. That blank space is an invitation. That hyperlink is a trapdoor to deeper knowledge. That video is a Rorschach test for your team’s football IQ.

The final whistle blows when everyone leaves the room feeling like a co-author of the plan, not just an audience member. That’s the difference between talking at your team and building with them. Ditch the monologue. Start the lab.

Conclusion

Let’s be blunt. After this tour, your slide deck is outdated. What you now hold is a cognitive framework. Your player meeting templates are the blueprint for your team’s collective intelligence.

We started with the basics of narrative and moved to the details of feedback slides. We explored audience politics and the importance of timing. The evidence shows that interactive models are the winners.

The real goal was never just to share information. It was to build intellectual architecture. The best player meeting templates work like a well-designed cockpit. They make complex strategies simple to execute.

Your template is that cockpit. It turns complex strategies into clear actions. It’s where challenges and creativity meet. This is the wise person’s final move: creating the space, not being the star.

So, stop just making slides. Start building understanding. Create a template that thinks with your team, not just talks at them. The playbook is ready. It’s your turn.

Example Slide Decks for Coaches and Managers: Inspire Engaged Team Meetings

Let’s be honest: the phrase “team meeting” often triggers a fight-or-flight response more intense than a last-second playoff drill.

We’ve all been there—staring at a screen of endless bullet points, wondering if this is what purgatory looks like in the corporate world.

But what if your slide deck could be the catalyst for engagement, not the cause of existential dread?

This is your playbook for transformation. We’re moving beyond the tired, text-heavy templates of yore.

Drawing from the savvy of professional coaches who use customizable PowerPoint PPTs to illustrate key concepts and foster collaborative learning environments, we’ll analyze how the right visual framework can turn a mandatory meeting into a strategic huddle.

Think of it as the difference between a monologue and a dialogue, between informing your team and inspiring them.

We’ll unpack why a well-crafted deck is the ultimate tool for a manager-coach, blending analytical insight with a dash of wit to keep your audience—whether they’re sales reps or software engineers—leaning in, not tuning out.

The best  sports presentation inspiration often comes from understanding the mechanics behind the magic. It’s not just about pretty pictures; it’s about constructing a narrative that tracks progress and enhances communication, much like a coach’s playbook.

Importance of Visual Storytelling in Sports

Visual storytelling in sports is more than just pretty pictures. It’s a way to make complex strategy simple for players. The brain processes images 60,000 times faster than text. In a timeout, you need a quick visual cue, not a long lecture.

Coaching presentation tools are key here. They’re not just for showing plays. They help coaches communicate better. The best sports slide examples turn simple ideas into lasting memories.

Think of legends like Phil Jackson and Pat Summitt. They didn’t just teach plays; they told stories. Their visual storytelling was unmatched, even before “data viz” became popular.

A defensive scheme isn’t just a diagram. It’s a story of teamwork and trust. It explains why the team does what it does. When players see their role in this story, they’re more committed.

This method helps players understand complex ideas easily. Ideas like “off-ball movement” become clear when shown visually. The right sports slide examples make these ideas actionable and shared.

Forget boring film sessions. Visual tools help build a shared mental model. Every player sees the big picture, not just their part. They understand the timing and flow.

This is the true power. It’s not about replacing the playbook. It’s about making strategy come alive for today’s athletes. When strategy is a story, action becomes instinct.

Slide-by-Slide: Walkthrough of a Model Slide Deck

A coach’s playbook is more than just a list of plays. It’s a visual guide that helps the team work together. We’ll explore each slide, from the big picture to the small details. It’s like decoding the secrets of coach communication.

Every slide has a purpose. It’s not just to fill space. It shapes the team’s mindset and guides their actions. Let’s dive into the sequence.

Introduction

Your first slide is like the trailer for your season. It should grab attention and explain why this meeting matters. Use a strong image or a thought-provoking quote to set the tone.

This slide is your main message. Are you bouncing back from a loss or starting a new strategy? It answers the players’ question: “Why should I care?”

Goals

Goals can’t be vague, like “get better.” They need to be clear and measurable. Use the SMART framework to make them specific and achievable.

Instead of lists, use graphics with icons. Show progress, like “Increase free-throw accuracy to 85% by mid-season.” A goal slide should feel like a promise, visible to everyone.

This is where coach communication shifts from telling to working together.

Strategy

Goals are the end goal. Strategy is the path to get there. This section is your game plan. Use flowcharts to show a new defensive setup. Compare it to chess or music to make it simple.

Showing, not just telling, makes complex strategies easy to follow. A good strategy slide breaks down the “what” and “how” into easy steps. It turns abstract ideas into actions.

Practice Schedule

Strategy needs a plan for practice. The practice schedule slide is the detailed plan. It outlines the weekly or daily steps to make the strategy real.

Use a timeline or calendar view. Color-code drills by focus area. This keeps the team focused on the process, not just the result.

Great coaching communication often draws inspiration from many disciplines, including leadership studies, psychology, and even storytelling techniques found in diverse translated literature. These perspectives help coaches structure ideas clearly and communicate strategies in ways that resonate with players from different backgrounds.

A well-designed practice schedule slide makes preparation visible. It shows players how daily effort connects directly to long-term improvement and team success.

A professional slide deck presentation, focusing on a practice schedule for coaches and managers. In the foreground, a sleek laptop displays a colorful slide titled "Practice Schedule," showcasing a well-organized weekly plan with engaging visuals. The middle ground features a modern meeting room setup, with a polished wooden table, comfortable chairs, and a projector casting the slide onto a screen. In the background, large windows let in natural light, enhancing the atmosphere of collaboration and engagement. The mood is inspirational and focused, conveying a sense of professionalism and teamwork. Use a wide-angle lens effect to capture the entire scene, emphasizing the high-tech feel of the setting. The lighting should be soft and inviting, highlighting the details of the slide and the room's design.

Here’s a sample breakdown of how a weekly schedule visualizes the commitment:

Day Focus Area Key Drill Success Metric
Monday Fundamental Skills Form Shooting & Ball Handling Circuits 90% completion rate, recorded on video
Wednesday Tactical Implementation Half-Court Defensive Scenarios Less than 3 breakdowns in a 10-minute scrimmage
Friday Conditioning & Review Full-Court Transition Drills & Film Session Player-led identification of 2 key improvements

Accountability

The final slide is about measuring success. It’s about feedback and evaluation. Use templates for peer review or self-assessment.

A strong slide here might show a KPI dashboard. Visualize metrics like “practice attendance” or “goal progress.” It shows the process is tracked.

This turns accountability into a shared journey. It’s the key to open coach communication, showing every effort counts.

Real-Life Examples From Winning Coaches

Let’s dive into the real world. The playbooks of top coaches are our best sports slide examples. They used chalkboards and napkins, but their ideas are timeless.

Phil Jackson’s triangle offense showed each player’s role clearly. Vince Lombardi’s simple drawings could be followed in any weather. This is about telling stories with visuals under pressure.

John Wooden’s “Pyramid of Success” was more than a list. It was a visual guide. Today, it’s the Diamond Coaching Model, helping players grow step by step.

Below is a table showing famous coaching tools and their modern counterparts.

Coach (Sport) Iconic Visual Tool Modern Template Parallel Core Principle
John Wooden (Basketball) Pyramid of Success Diamond Coaching Model Structured, layered development
Vince Lombardi (Football) Power Sweep Diagram WOOP Model (Wish, Outcome, Obstacle, Plan) Goal-oriented, obstacle-focused strategy
Phil Jackson (Basketball) Triangle Offense Charts Mentoring Consulting Slides Systemic interaction and role clarity

Lombardi’s power sweep was a simple yet powerful idea. The WOOP Model slide does the same for your team’s goals. It’s all about clear action.

Jackson’s triangles showed how players worked together. Modern mentoring slides do the same for advisor-mentee relationships. It’s about systems, not just speeches.

The key is Simplicity under fire. These coaches turned chaos into clear images. Your next team meeting will have its own chaos. Use their clarity to guide you.

Think of it as legally borrowing from the best. Your playbook is ready.

Case Study

The most powerful coaching tool isn’t a motivational quote; it’s a brutally honest pie chart.

Let me prove it. We’re moving from theory to the trenches. Our subjects: Emily, a sharp life coach, and Susan, a marketing VP whose spirit was being flattened by the corporate conveyor belt. Susan dreamed of sourdough and scones but was paralyzed by the leap. Emily’s weapon of choice? A slide deck.

This wasn’t a generic pep talk. It was a targeted, visual intervention. We’ll forensically examine three slides that changed everything. This is the ultimate test of coach communication—transforming vague anxiety into actionable insight.

The Introduction Slide: Setting the Psychological Table

Emily’s first slide was deceptively simple. No corporate logo. Just a clean title: “Susan’s Path Forward.” This immediately framed the session as a collaborative journey, not a lecture.

It established a contract. Susan wasn’t just a passive listener; she was the co-author of her own story. This subtle shift is key. The best team meeting slides, even for a team of one, create a space for focused, purposeful dialogue.

The “Understanding Susan” Slide: Emotional Cartography

The next slide was where the magic—and the medicine—began. On the left, a “Feelings Wheel.” Susan pinpointed “trapped,” “drained,” and a flicker of “hopeful.”

This wasn’t touchy-feely fluff. It was a diagnostic tool. It gave a name to the nebulous dread. Emily could now address the specific emotional toxins, not just the symptoms.

On the right, a pie chart. A cold, hard data visualization of Susan’s weekly hours: 50% work, 25% work anxiety, 15% chores, 10% sleep. The “work anxiety” slice was the killer. Seeing her fear consume a quarter of her life was the gut punch Susan needed. A speech couldn’t have done that.

A modern conference room setting with a large screen displaying professional slides for a case study analysis in a team meeting. In the foreground, a group of diverse professionals in business attire—two women and two men—are engaged in discussion, pointing at the slides. The middle ground features a sleek table with laptops, notebooks, and coffee cups, enhancing the collaborative atmosphere. The background showcases a large window with city views, allowing natural light to flood the room, creating a bright and inviting environment. The overall mood is dynamic and focused, reflecting a productive team brainstorming session during a pivotal analysis. The image should be shot from a slightly elevated angle to capture the entire setting effectively.

Emily deployed the “Wheel of Life” next. Eight segments—Career, Finance, Health, Family, etc.—each rated by Susan on a scale of 1-10. Her “Career” score was a 2. “Personal Growth” was a 3.

But “Creativity” and “Physical Environment” sparked to an 8 when she imagined her bakery. The visual was undeniable. Her dissatisfaction had a shape. Her path had a form.

This slide moved the conversation from “what’s wrong” to “what could be right.” It provided the visual blueprint for her escape route.

The transformation was catalyzed by visuals, not just words. This case study proves that the principles of great team meeting slides—clarity, data, and visual storytelling—are universal. They work for a boardroom and a one-on-one coaching session.

Slide Key Component Function Impact on Susan
Introduction Clean title, collaborative framing Set psychological safety & session intent Shifted from passive participant to active collaborator
Understanding Susan Feelings Wheel & Time-Analysis Pie Chart Emotional & temporal diagnostic Named specific emotions; visualized time waste as tangible data
Susan’s Dreams Wheel of Life assessment Visual blueprint for life balance & goals Translated vague dreams into a structured, visual plan

Emily’s deck was a masterclass in coach communication. It used slides not to broadcast information, but to pull insight from the client. The Feelings Wheel diagnosed. The pie chart confronted. The Wheel of Life inspired.

For Susan, the deck became a mirror. And in that reflection, she didn’t just see a frustrated executive. She saw a future baker. That’s the power of a well-crafted slide deck. It doesn’t just convey a message; it can change a mind, and sometimes, a life.

How to Adapt for Your Needs

Great presentations aren’t copied; they’re adapted, like a jazz musician improvising on a standard. You’ve seen the masterpieces. The real trick is avoiding a derivative forgery. It’s about tailoring the suit to fit your unique game.

The core principles we’ve dissected—visual storytelling, structured narrative, emotional diagnostics—are your raw materials. As noted in industry tools, the best platforms let you tweak content on the fly and repurpose it for other mediums. That’s the flexibility you need. For leadership teams, this adaptation is key for strategic planning, change management, and team development.

Think of it as a translation exercise. The table below shows how to hack classic coaching slides for your world.

Original Slide Concept Adapted Use Case Key Transformation
Practice Schedule Corporate Project Timeline Swap drills for milestones. Layer in a RACI matrix for accountability.
Feelings Wheel Creative Brainstorm Session Morph it into an “Idea Spectrum” to gauge team reactions from “Revolutionary” to “Needs Work.”
Introduction & Values Team Alignment Brief Frame it as a “North Star” memo. Why are we here? What’s our playing philosophy?
Accountability Chart Quarterly Review Dashboard Turn player stats into KPIs. Highlight the “assists” between departments.

This is the intellectual framework for repurposing. Are you a manager rolling out a new ops strategy? That “Practice Schedule” slide is now a Gantt chart with soul. Leading a non-profit volunteer rally? The pre-game pep talk becomes a mission-impact story.

The goal is to find your own presentation inspiration. Use these examples not as blueprints to trace, but as archetypes to remix. It’s the difference between renting a template and holding the mortgage.

Start with a solid foundation. Explore versatile coaching pitch deck templates for structure. Then, make it yours. Change the fonts. Swap the images. Rewrite the narrative. That’s how you own the room.

Resources

Analysis is just the start. You need the right tools to make it happen. Think of this as your go-to equipment locker. We’re diving into the essential resources that will take your game to the next level.

Let’s sort out the top picks. Need a full system? The “Performance Coaching PowerPoint Presentation Slides” bundle is your guide. For specific issues, templates like “WOOP Coaching Model” or “Diamond Coaching Presentation Slides” offer targeted solutions.

Your tech is key. Is a classic PowerPoint template your best choice? Or do you need something like Beautiful.ai for speed and design ease? Its AI can whip up team meeting slides in no time.

This isn’t just a list. It’s a guide on choosing the right tool for your goal. Whether you’re looking for sports slide examples or presentation ideas, we’ve got you covered.

Find the perfect template to boost your coach communication. The right slides can turn a meeting into a strategic session. Your post-game report, packed with insights, begins here.

How to Create Inclusive Presentations for Diverse Sports Teams

Let’s be honest. That motivational poster in the locker room? It’s not winning any games.

Sport has this legendary power to unite people. It’s a truth we all feel. But when you stand before your team, that unity isn’t a given. It’s something you build. And your slideshow? It’s your most powerful tool, or your biggest liability.

I’ve seen the deflated-ball impact of a “one-size-fits-all” talk. Why does it fail? It ignores the beautiful, complex reality of your roster. Your team is a microcosm of the world itself.

This isn’t about checking an ethical box. It’s a strategic imperative. Embracing diversity in your communication directly fuels success. We’re talking about unlocking new plays, building unbreakable loyalty, and creating a community that doesn’t just play together—it wins together.

Creating inclusive presentations also means ensuring your materials are usable for everyone in the room. Prioritizing presentation accessibility helps coaches communicate ideas clearly while making sure every athlete can fully engage with the message

Forget just playing the game. Let’s talk about winning the room.

Understand Your Team’s Backgrounds

Getting to know your team’s cultural landscape is a smart move. It’s more than just a spreadsheet. True understanding starts where the demographic checklist ends.

Knowing the mix of race, ethnicity, gender, age, sexual orientation, and abilities is important. It’s the starting point. But the real game is in the cultural nuances and lived experiences. These things affect how your message is received.

A diverse group of athletes sits together in a bright, modern conference room, each dressed in professional sports attire, discussing their unique backgrounds. In the foreground, focus on a Black female athlete passionately speaking, while a South Asian male athlete listens attentively with a thoughtful expression. In the middle, a Hispanic female athlete shares her perspective, and a Caucasian male athlete nods in agreement, symbolizing camaraderie and support. The background features a large window, flooded with natural light, showcasing an urban sports complex outside, while motivational posters highlighting teamwork adorn the walls. The atmosphere is one of unity and understanding, emphasizing inclusiveness and respect for diverse perspectives, with soft, warm lighting enhancing the welcoming environment. Capture the scene with a slight angle, giving depth to the discussion unfolding among the engaged team members.

Is your team a mix of veterans and rookies? Do some athletes come from places where direct challenge is seen as disrespectful? Others might value vigorous debate.

This isn’t about trying to please everyone. It’s about precision. A presentation for a 22-year-old Olympic hopeful will differ from one for a 35-year-old pro with a business degree.

The goal of diversity in sports isn’t just token representation. It’s to create an environment that values human difference. A team that’s just a collection of demographic boxes is not cohesive.

Your role is like being a conductor who knows each instrument’s unique sound. Map this human landscape without reducing people to categories. What are their communication preferences? What references will they get? What might alienate them?

This deep dive turns your presentation into a conversation. It’s the strategic advantage you gain when you see backgrounds as the texture of your team’s collective intelligence.

Language Options and Visual Accessibility

Google Translate offers a wide range of language options, making it a valuable tool for users worldwide. Whether you need to translate text, communicate with someone who speaks a different language, or explore content in various languages, Google Translate has you covered.

With Google Translate, you can translate text in over 100 languages. Whether you’re a traveler, a student, or a professional, you can easily communicate with people from different backgrounds. The platform supports both written and spoken languages, allowing you to engage in conversations and understand written content in your target language.

Google Translate also provides visual accessibility features to enhance the user experience. The platform offers a full-screen mode, which removes distractions and allows you to focus on the translation. This feature is ideal for users who prefer a clutter-free environment while using the translation tool.

Another visual accessibility feature offered by Google Translate is the ability to adjust font sizes. Whether you have visual impairments or simply prefer a larger font, you can easily customize the font size to suit your needs. This feature ensures that you can comfortably read and understand the translated text.

Google Translate’s language options and visual accessibility features make it a versatile and user-friendly tool for language translation. Whether you’re a language learner, a traveler, or simply someone who wants to explore content in different languages, Google Translate has the capabilities to meet your needs.

Benefits of Google Translate’s Language Options and Visual Accessibility Features:

  • Wide range of language options for text translation
  • Support for both written and spoken languages
  • Full-screen mode for a distraction-free experience
  • Adjustable font sizes for visual accessibility

With Google Translate, you can easily communicate with people from different linguistic backgrounds, explore content in various languages, and enhance your language learning experience. Whether you’re a beginner or an advanced language learner, Google Translate’s language options and visual accessibility features make it a valuable tool for language translation.

FAQ

Q: What is a presentation?

A: A presentation is a way to share information with others. It can be in person or online. It uses visual aids like slides, videos, and images to get the message across.

Q: What are the different types of presentations?

A: There are many types of presentations. Some common ones include sales pitches, educational talks, and business meetings. Each type has its own purpose and style.

Q: How can I make my presentations more engaging?

A: To make your presentations engaging, use storytelling techniques. This makes your message more relatable and memorable. Also, use visual aids like images and videos to keep your audience interested.

Q: What are some tips for creating effective presentations?

A: To create effective presentations, focus on your message. Make sure it is clear and concise. Use visual aids to support your message. And practice your presentation to feel confident and prepared.

Q: How can I make my presentations accessible?

A: To make your presentations accessible, consider the needs of your audience. Use clear and simple language. Provide captions for videos and audio. And make sure your presentation is easy to read and navigate.

Q: What are some best practices for creating accessible presentations?

A: To create accessible presentations, use clear and simple language. Provide captions for videos and audio. Make sure your presentation is easy to read and navigate. And test it on different devices and browsers to ensure it works for everyone.

Q: How can I create a visually appealing presentation?

A: To create a visually appealing presentation, use high-quality images and videos. Choose a consistent color scheme and font style. And make sure your presentation is easy to read and navigate.

Q: What are some tips for delivering a successful presentation?

A: To deliver a successful presentation, practice your delivery. This will help you feel confident and prepared. Make eye contact with your audience and use body language to engage them. And be prepared to answer questions and address any concerns.

Q: How can I make my presentations more engaging?

A: To make your presentations more engaging, use storytelling techniques. This makes your message more relatable and memorable. Also, use visual aids like images and videos to keep your audience interested.

Q: What are some best practices for creating accessible presentations?

A: To create accessible presentations, use clear and simple language. Provide captions for videos and audio. Make sure your presentation is easy to read and navigate. And test it on different devices and browsers to ensure it works for everyone.

Q: How can I create a visually appealing presentation?

A: To create a visually appealing presentation, use high-quality images and videos. Choose a consistent color scheme and font style. And make sure your presentation is easy to read and navigate.

Q: What are some tips for delivering a successful presentation?

A: To deliver a successful presentation, practice your delivery. This will help you feel confident and prepared. Make eye contact with your audience and use body language to engage them. And be prepared to answer questions and address any concerns.

FAQ

Q: What is a pre buy car inspection?

A: A pre buy car inspection is a thorough examination of a vehicle’s condition before purchasing it. It involves checking various components such as the engine, transmission, brakes, suspension, and electrical systems to identify any existing issues or hidden problems.

Q: Why is a pre buy car inspection important?

A: A pre buy car inspection is important because it helps you make an informed decision when buying a used car. It allows you to identify any underlying issues or hidden problems that may not be apparent during a test drive or visual inspection. By getting a professional inspection, you can avoid costly repairs and ensure that you are getting a reliable vehicle.

Q: What does a pre buy car inspection include?

A: A pre buy car inspection typically includes a thorough examination of the vehicle’s exterior, interior, engine, transmission, brakes, suspension, electrical systems, and more. It may also involve specialized tests such as a vehicle history report, a road test, and a detailed inspection report.

Q: How long does a pre buy car inspection take?

A: The duration of a pre buy car inspection can vary depending on the complexity of the vehicle and the extent of the inspection. On average, it can take anywhere from 1 to 3 hours to complete a thorough inspection.

Q: Can I be present during the pre buy car inspection?

A: Yes, you are encouraged to be present during the pre buy car inspection. This allows you to ask questions, gain a better understanding of the vehicle’s condition, and receive expert advice from the inspector.

Q: How much does a pre buy car inspection cost?

A: The cost of a pre buy car inspection can vary depending on factors such as the location, type of vehicle, and the extent of the inspection. On average, it can range from $150 to $300. It is important to note that the cost is a small investment compared to the peace of mind and financial savings it can provide.

Q: Can I get a pre buy car inspection for other types of vehicles?

A: Yes, in addition to cars, we also offer pre buy inspections for trucks, RVs, motorcycles, heavy equipment, and more. Our experienced inspectors can provide a thorough evaluation of any type of vehicle or equipment you are considering purchasing.

Q: How can I schedule a pre buy car inspection?

A: Scheduling a pre buy car inspection is easy. Simply contact us at (979) 530-3725 or visit our website to request an appointment. Our team will work with you to find a convenient time and location for the inspection.

Real-Life Inclusive Presentation Examples

Forget hypothetical scenarios—the real masterclass in inclusive communication happens when the whistle blows. Diverse athletes need to understand complex plays, especially as organizations adopt next-gen media streaming solutions to deliver training content across different abilities and environments. Let’s break down actual game footage of inclusion in action.

First up: Move United. Picture explaining adaptive sports rules to a mixed-ability group of athletes, coaches, and volunteers. Their challenge? Creating clarity across physical, sensory, and cognitive differences.

Their playbook is genius. They use visual demonstrations that show, not just tell. Simplified language modules break down complex rules. Hands-on practice sessions let everyone feel the game. The result? A truly multicultural team in terms of ability, all on the same page.

A diverse group of professionals presenting in a well-lit conference room, showcasing an inclusive presentation. In the foreground, three team members of different ethnic backgrounds (Black, Asian, Hispanic) stand confidently by a large screen, pointing at a vibrant infographic about teamwork and sports inclusivity. The middle layer features a sleek round table with laptops open and notepads, creating an engaging collaborative atmosphere. Bright but soft lighting from overhead fixtures casts a warm glow, enhancing the welcoming mood. In the background, a large window shows a sunny day outside, adding to the positive ambiance. Everyone wears professional attire, reflecting a serious yet approachable tone as they engage each other and the audience, conveying the essence of teamwork and diversity.

Then there’s Special Olympics Minnesota and Project ALL STAR. Here’s where it gets interesting. Athlete Kayte Barton wasn’t just a research subject. She was a partner in the evaluation project.

Presentations about data and implications were designed with her input. Complex statistics became accessible stories. Jargon transformed into plain language everyone could grasp. The athletes helped shape how information was shared.

Now consider a global soccer club. Their squad comes from a dozen different countries. How do you present a new training regimen without losing anyone?

The winning strategy involved multilingual summaries of key points. Culturally resonant analogies compared drills to familiar local sports. Visuals transcended language barriers completely. For more inspiration on structuring such sessions, check out these presentation ideas for diversity and inclusion.

These organizations aren’t just talking about inclusion. They’re executing it daily. Their methods offer a blueprint for any team facing diversity challenges.

Organization Primary Challenge Inclusive Presentation Strategy Measurable Outcome
Move United Communicating adaptive sports rules to mixed-ability participants Visual demonstrations, simplified language modules, hands-on practice Increased volunteer retention by 40%
Special Olympics (Project ALL STAR) Presenting research data to athletes with intellectual disabilities Athlete partnership in presentation design, jargon-free language, data storytelling 90% athlete comprehension of evaluation results
Global Soccer Club Training regimen rollout across multicultural teams Multilingual summaries, cultural analogies, universal visuals Reduced implementation time by 60%
Disabled Sports USA Recruiting diverse volunteers for adaptive programs Virtual reality previews, ambassador testimonials, clear role definitions Tripled volunteer applications in target demographics
Sporting Equals Engaging ethnically diverse communities in mainstream sports Community-led presentation formats, culturally relevant case studies Increased participation from underrepresented groups by 35%

Notice the pattern? Each successful example starts with understanding the audience’s actual needs. Not assumed needs. Actual, on-the-ground communication barriers.

They then design presentations around those specific barriers. The tools vary—visuals, language, practice, partnership—but the principle remains constant. Meet people where they are, not where you wish they were.

These case studies prove inclusion isn’t about political correctness. It’s about operational efficiency. When everyone understands the play, everyone executes better. The team wins. Simple as that.

Checklist & Resources

Think of this section as your locker room whiteboard – the final strategic scribbles before the big game. We’ve discussed the philosophy and the plays. Now, let’s talk equipment. This is your actionable prep sheet, transforming inclusive ideals into executable tactics anyone can run.

Every winning strategy needs a step-by-step plan. Follow this three-phase checklist to ensure your next team presentation doesn’t just talk about inclusion – it embodies it.

The Inclusive Presentation Game Plan

  1. Pre-Game: The Background Audit
    • Research your team’s cultural, linguistic, and neurodiverse makeup.
    • Identify primary languages and preferred communication styles.
    • Survey for any disclosed accessibility needs (hearing, vision, mobility).
    • Review past presentation feedback for recurring pain points.
  2. In-Game: The Multilingual & Visual Accessibility Setup
    • Prepare slides with high-contrast colors and clear, sans-serif fonts.
    • Create visual summaries alongside text-heavy data points.
    • Offer real-time captioning or sign language interpretation if needed.
    • Design interactive segments for kinesthetic learners.
    • Provide materials in multiple formats (digital, print, audio).
  3. Post-Game: The Feedback Review
    • Collect anonymous feedback through multiple channels (digital, verbal, written).
    • Analyze responses from historically quiet team members.
    • Document what worked and what created barriers.
    • Update your “playbook” for the next presentation cycle.

This framework ensures you’re not just checking boxes, but building a culture of accessible communication. For a deeper dive into structured planning, examine this diversity, equity, and inclusion checklist for conference. The principles translate perfectly from the boardroom to the locker room.

Your Digital Accessibility Arsenal

Now for the heavy artillery. In today’s world, your playbook often lives online. That’s where tools like Recite Me become your all-star accessibility coach.

Their 40-page Digital Accessibility & Inclusion Toolkit is the strategic deep dive you need. Think of it as the film study for breaking down online barriers – analyzing everything from screen reader compatibility to keyboard navigation.

But they don’t stop at theory. Recite Me’s on-demand toolbar and checker are the practical drills. The toolbar lets users customize your site’s appearance and content to their needs in real-time. The checker proactively scans your digital content for compliance gaps before anyone points them out.

It’s like having an instant replay system for accessibility, ensuring no player gets left behind on the digital field.

Building Your Coaching Library

Beyond specific tools, build your resource library with frameworks from organizations like The Inclusion Playbook. These provide the structured “plays” – the standardized processes and policies that make inclusion repeatable, not random.

Combine these frameworks with your own lived experience and team feedback. The goal isn’t a perfect, one-size-fits-all presentation. It’s a continuously adapting approach that learns from every huddle, every game, every season.

This section was your equipment room. We’ve handed you the checklist, the tools, and the playbooks. The final step? Actually suiting up and running the plays. Your team’s engagement depends on it.

FAQ

Q: What is a pre buy car inspection?

A: A pre buy car inspection is a thorough examination of a vehicle’s condition before purchasing it. It involves checking various components such as the engine, transmission, brakes, suspension, and electrical systems to identify any existing issues or hidden problems.

Q: Why is a pre buy car inspection important?

A: A pre buy car inspection is important because it helps you make an informed decision when buying a used car. It allows you to identify any underlying issues or hidden problems that may not be apparent during a test drive. This can save you from costly repairs in the future and ensure that you are getting a reliable vehicle.

Q: What does a pre buy car inspection include?

A: A pre buy car inspection typically includes a detailed examination of the vehicle’s exterior, interior, engine, transmission, brakes, suspension, electrical systems, and more. It may also involve a test drive to assess the vehicle’s performance and identify any unusual noises or vibrations.

Q: How long does a pre buy car inspection take?

A: The duration of a pre buy car inspection can vary depending on the complexity of the vehicle and the extent of the inspection. On average, it can take anywhere from 1 to 3 hours to complete a thorough inspection.

Q: Can I be present during the pre buy car inspection?

A: Yes, it is highly recommended to be present during the pre buy car inspection. This allows you to ask questions, gain a better understanding of the vehicle’s condition, and address any concerns you may have.

Q: How much does a pre buy car inspection cost?

A: The cost of a pre buy car inspection can vary depending on factors such as the location, type of vehicle, and the level of detail required. On average, it can range from $150 to $300. It is important to note that the cost is a small investment compared to the peace of mind and savings it can provide.

Q: Can I get a pre buy car inspection for other types of vehicles?

A: Yes, pre buy car inspections are not limited to cars. They can also be conducted for motorcycles, RVs, boats, and even heavy equipment. Our certified inspectors have the expertise to evaluate a wide range of vehicles and provide you with a detailed report on their condition.

Q: How do I schedule a pre buy car inspection?

A: Scheduling a pre buy car inspection is easy. Simply contact us at (979) 530-3725 or visit our website to request an appointment. Our team will work with you to find a convenient time and location for the inspection.

Q: What if the inspection reveals issues with the vehicle?

A: If the inspection reveals any issues or concerns with the vehicle, you have the option to negotiate the price or walk away from the purchase. It is important to have all the information you need to make an informed decision.

Q: Are your inspectors certified?

A: Yes, our inspectors are certified professionals with extensive experience in the automotive industry. They undergo regular training and stay up-to-date with the latest inspection techniques and technologies to provide you with accurate and reliable evaluations.

Q: Do you offer mobile inspection services?

A: Yes, we offer mobile inspection services for your convenience. Our certified inspectors can come to your location, whether it’s a dealership or a private seller, to conduct the inspection on-site.

Q: Can I get a detailed report after the inspection?

A: Yes, after the inspection, you will receive a detailed report that outlines the condition of the vehicle. The report will include any issues or concerns identified during the inspection, along with recommendations for repairs or maintenance.

Technology Tools for Modern Sports Presentations

Remember the chalkboard play diagram, that relic of coaching antiquity? It’s been upgraded to something considerably more cinematic. We’re not just moving X’s and O’s anymore; we’re orchestrating a digital spectacle.

The halftime talk has evolved from a pep talk into a multimedia command center. Today’s playbook is dynamic, interactive, and data-driven. It’s the difference between sending a telegram and launching a viral campaign—the core message remains, but the impact isn’t even the same game.

This shift isn’t about replacing gut instinct with processors. It’s about amplifying passion with precision. From high-performance training rooms to digital strategy hubs, the right tools transform raw emotion into executable strategy.

So, what does this new era of sports tech look like? We’re talking about platforms that make static slides look like cave paintings. We’re entering the world of intelligent dashboards and immersive live presentation tools that engage everyone from the rookie to the season ticket holder.

Top Presentation Software for Coaches

Choosing your presentation software is like picking your starting quarterback. You need someone reliable, versatile, and smart. PowerPoint and Keynote are okay for practice but not for the big game.

What you need are presentation apps made for the heat of the moment. They’re like the brain of your strategy. The best ones let you switch between different views easily.

This isn’t just about showing slides. It’s about making your team work together like a well-oiled machine. Modern software has sport-specific templates and lots of plays to choose from. You start with a plan, not a blank page.

Interactive whiteboards are where the magic happens. They turn a one-way presentation into a two-way conversation. You can draw plays, shade coverage, and ask your team to find weaknesses on the fly.

This is where audience engagement tech really shines. The software isn’t just for showing slides. It has features for live polls and quick quizzes to test player knowledge. It makes learning active, not passive.

Your playbook becomes a living document. Your film sessions become interactive labs. The right platform doesn’t just present information. It helps your team internalize it. That’s the difference between talking about a formation and living it.

Integrating Video Analysis & Instant Replay

The magic of sports tech today is in the detailed breakdown of each play. We’ve moved from old film sessions to a high-tech command center. Now, video analysis software offers a detailed look at every play, like a Hollywood director’s cut.

This isn’t just about watching the game again. It’s about focusing on a single player’s move, matching it with the quarterback’s view, and adding play diagrams. Before the game ends, you can have a detailed analysis ready. The clarity we see on TV, like VAR and Hawk-Eye, is now expected in team meetings.

So, what tools do we have? Top platforms combine capture and critique. They offer synchronized playback, clear slow-motion, and real-time annotation. A coach can mark up a frame with arrows, making corrections clear and direct.

This change turns passive review into active learning. It speeds up understanding by making corrections immediate and clear. The film room becomes a place for teamwork, not just lectures.

When picking a system, look for key features. Not all video analysis software is the same. Here’s what to check:

Feature Basic Tool Advanced Forensic Platform
Video Quality & Playback Standard definition, single-angle replay. Multi-angle HD streams, synchronized side-by-side playback, frame-by-frame slow-motion.
Analysis & Annotation Basic drawing tools (line, circle). Real-time drawing, telestration, customizable arrows/shapes, text overlays, saveable templates.
Integration & Sharing Manual file export, limited sharing. Cloud storage, instant sharing to player apps, integration with wearables & performance data.
Influence from Pro Tech Standalone system. Tools inspired by VAR/Hawk-Eye for precise spot & trajectory analysis.

The gap between TV magic and real sports analysis has narrowed. The right video analysis software shows not just what happened, but why and how to improve. This is the new standard. Anything less is just watching the game.

Interactive Polling and Live Q&A

The most dangerous sound in coaching isn’t the opponent’s celebration—it’s the deafening silence of your team not understanding the game plan. You’ve diagrammed the perfect blitz. You’ve highlighted the offensive tendency. Yet, in the eyes staring back, you see confusion masquerading as comprehension. This is where traditional presentations fail and modern audience engagement tech becomes your secret weapon.

Think of your next strategy session not as a lecture but as a live studio show. Your players are the studio audience, and you have the ability to poll them in real time. “Raise your virtual hand if you think we should play zone here.” Instant results appear. You’re not guessing anymore. You’re knowing. This transforms the dynamic from teacher-student to collaborator-participant.

A modern, vibrant conference room filled with a diverse audience engaged in interactive polling and live Q&A. In the foreground, a group of three professionals in business attire operates a sleek touchscreen device displaying live polling results. In the middle, participants of various ethnicities and ages sit at round tables, some raising their hands eagerly to ask questions, while others focus intently on their devices. Soft, ambient lighting highlights their expressions of curiosity and engagement. In the background, a large digital screen displays dynamic graphics of polling data with colorful visuals enhancing the atmosphere of interactivity. The scene is well-composed from a slightly elevated angle, capturing the energy and excitement of modern technology in sports presentations.

The best live presentation tools now embed these interactive features directly into your slides. Imagine throwing a question to the room: “What one word describes their quarterback’s weakness under pressure?” Responses flood in. A word cloud forms on screen, growing larger around terms like “panicky” or “left-side blind.” Suddenly, you’re not telling your team what to think. You’re showing them what they already collectively understand.

This technology isn’t borrowed from corporate boardrooms. It’s evolved from the fan engagement features used by major sports networks. Those real-time polls during the broadcast? The live Q&A sessions with analysts? That same audience engagement tech is now available for your internal meetings. It creates a feedback loop that’s immediate and authentic.

Consider the practical applications. After explaining a new defensive coverage, launch a quick quiz. Three multiple-choice questions. The results tell you instantly if you need to re-explain the strong safety’s role. Use anonymous polling to gauge confidence levels before a big game. The data is invaluable. These live presentation tools turn abstract concepts into measurable understanding.

The psychological shift is profound. Players move from passive recipients to active contributors. They’re invested because their input visibly matters. When you ask for questions via a live digital queue, you’ll get more—and better—questions than the usual awkward silence. Shy players participate anonymously. Vocal leaders have a structured outlet. It democratizes the conversation.

This approach answers the coach’s eternal, unspoken question: “Are they getting this?” before Friday night’s lights expose the truth. It replaces the monologue—a format as outdated as the leather helmet—with a genuine dialogue. You’re no longer broadcasting your wisdom into the void. You’re conversing with a team that’s actually listening, processing, and responding.

The tools themselves are surprisingly simple. Platforms like Mentimeter, Slido, and even built-in features in PowerPoint Live allow you to embed polls directly into your presentation. Participants respond via their phones or laptops. No extra apps. No complicated setup. The barrier to entry is lower than installing a new offensive scheme.

Embrace this shift. Your playbook presentations should be as dynamic and responsive as your game-day adjustments. With interactive polling and live Q&A, you’re not just sharing information. You’re building collective intelligence. You’re turning your meeting room into a laboratory where strategy is tested, understood, and owned by everyone wearing the same colors.

Mobile-Friendly Presentations

If your sports presentation can’t survive the journey from the 70-inch touchscreen to the 6-inch smartphone, it’s already benched. Mobile connectivity isn’t a bonus feature anymore—it’s the primary interface. Today’s athletes live on their devices, and your coaching materials need to meet them there.

The playbook used to be a physical binder, as outdated as a flip phone. Now, it’s a dynamic, living document in the cloud. The best presentation apps understand this shift completely. They render complex formations and strategy breakdowns perfectly on any screen.

This isn’t just about shrinking content to fit. It’s about redesigning information for the mobile mind. We’re talking scrollable formats, tap-friendly navigation, and bite-sized modules. An athlete shouldn’t need a desktop to understand their role in tomorrow’s game.

Multi-device integration is the secret sauce. A linebacker reviews coverage schemes on his tablet during rehab. A point guard watches edited highlights on her phone on the team bus. The cloud ensures everyone has the latest version, always. Knowledge is no longer locked in a film room.

This turns wasted minutes into study sessions. The commute, the hotel room, the pre-game wait—all become opportunities for reinforcement. Modern sports tech acknowledges our fragmented attention and works with it.

Many modern presentation tools now extend beyond the laptop or projector. Integrating mobile integration in sports presentations allows coaches to share slides, clips, and key updates directly to players’ devices, making meetings more interactive and ensuring important information remains accessible after the session ends.

Consider the difference between old-school and mobile-first approaches:

Feature Traditional Approach Mobile-First Approach Impact on Engagement
Access Limited to facility computers Cloud-based, 24/7 on personal devices High – removes physical barriers
Format Linear slide decks Scrollable, modular content chunks Medium-High – fits modern consumption
Update Speed Manual distribution needed Instant synchronization across all devices High – ensures everyone has latest info
Interactivity Minimal, if any Built-in polls, quizzes, tap-to-reveal High – keeps users active, not passive
Visual Design Optimized for large screens Responsive, mobile-first layouts Medium – critical for comprehension

The table shows a fundamental philosophy shift. Mobile-first isn’t an afterthought. It’s the design principle from day one. This changes how information is structured, delivered, and consumed.

For coaches looking to implement this, starting with mobile-optimized presentation templates is smart. These templates are built with responsive design in their DNA. They ensure your content looks professional everywhere.

The strategic advantage is clear. When your playbook lives in their pocket, reinforcement happens constantly. Muscle memory isn’t just physical—it’s mental too. Repetition away from the field builds confidence and understanding.

This is where sports tech truly separates from mere gadgets. It’s not about flashy features. It’s about meeting human behavior where it actually lives. On phones, between obligations, in moments of downtime.

The best presentation apps function like a great assistant coach. Always available, always prepared, always tailored to the individual. They turn scattered attention into focused learning, one scroll at a time.

Security & Safeguarding Data

Imagine your top strategy, the result of hours of film study, floating on an unsecured Wi-Fi. It’s a scary thought. In today’s data-driven world, your data is your strategic base. A lost playbook is now a digital threat, haunting every coach who values tools over security.

This isn’t just about passwords. It’s about protecting valuable data. Your video analysis software is a treasure. It needs strong defense. Think encrypted channels and strict access controls to keep your plays safe.

Seamless sharing is key, but it must be on secure, private networks. An open port or weak password is a disaster. Your game-planning tool should be secure, not a leaky faucet.

Now, let’s look at the other side: interaction. Modern audience engagement tech collects data. This includes player feedback and reaction times. Where does this data go? Who owns it? It’s not just data; it’s insight into your team’s mind.

Using audience engagement tech comes with big responsibilities. A breach can damage trust. You must handle this data with the same care as your video analysis software. Clear policies and strict access are essential.

So, how do you sleep at night? You treat your tech like a fortress. Demand encryption and role-based access for your video analysis software. Audit your data flow. In today’s game, the best play call is useless if leaked. Protect your digital space with the same zeal as the goal line.

Future Trends

Forget PowerPoint slides—the future of sports presentations is like Minority Report. We’re moving beyond flat screens to a world where data surrounds us. The next generation of live presentation tools will immerse you in the action.

Imagine a coach wearing smart glasses during practice. Augmented Reality (AR) brings play diagrams and strategies right onto the field. It’s like having a tactical guide painted on reality itself. This isn’t science fiction; it’s the next step for interactive coaching.

A futuristic conference room showcasing advanced live presentation tools. In the foreground, a sleek, interactive holographic display projects vibrant data visualizations and real-time analytics, with a diverse group of professionals in smart casual clothing engaged in discussion. The middle ground features modern tables equipped with integrated touchscreen technology, surrounded by comfortable seating designed for collaboration. In the background, large panoramic windows reveal a city skyline with flying drones and green spaces, symbolizing innovation. The room is bathed in soft, ambient lighting, creating a warm yet tech-savvy atmosphere. The camera angle is slightly elevated, capturing the interaction between people and technology, evoking a sense of excitement for the future of presentations in a dynamic environment.

Virtual Reality (VR) takes it further. Teams will do immersive walkthroughs instead of watching film. Players will see the game from their own perspective. The line between practice and actual gameplay will disappear. These presentation apps become simulation engines.

Artificial Intelligence (AI) is the silent partner. Your future live presentation tools will have a brain. They’ll automatically find the most relevant video sequences and generate new scenarios in real-time. They might even predict which visuals will best reach an athlete’s learning style.

Think of AI as your strategic editor. It sifts through vast amounts of data to find key insights. It highlights patterns humans might overlook. This turns coaches into curators, focusing on strategy over software.

The integration doesn’t stop there. The future combines VR, AR, and traditional interactive whiteboards seamlessly. Draw a play on a surface, and it comes to life as a holographic simulation. Discuss a defensive scheme, and see it executed by virtual players instantly. The technology becomes invisible—just the insight remains.

For fans, this means presentation apps that offer augmented experiences during broadcasts. Imagine pointing your phone at the TV and seeing real-time stats overlay the players. Or accessing a coach’s perspective during a critical timeout. The audience becomes part of the strategic conversation.

This evolution represents a fundamental shift. We’re moving from presentation as communication to presentation as experience. The tools won’t just convey information—they’ll generate understanding through immersion. The classroom becomes the field. The film session becomes the game.

The future isn’t about fancier slides. It’s about dissolving the barrier between idea and execution. When your playbook can breathe, walk, and react, you’re not just preparing athletes. You’re programming reality.

Success Case Studies

The lab for sports tech isn’t in Silicon Valley. It’s on the sidelines of stadiums and gyms. When the whistle blows, theory meets reality. Let’s look at teams that turned watching into winning.

AV-Worx transformed a football academy’s film room into a command center. Coaches use drone footage and telestrations during practice. This helps players understand spatial concepts 40% faster. It’s not magic; it’s sports tech in action.

Catapult’s ViperPod systems turned fatigue into data. One MLS team reduced injuries by 22% in a season. They showed players load management graphs every morning. “Rest” was no longer just a guess.

Hawk-Eye and VAR changed tennis and cricket. They made slow-motion 3D trajectories common. This deepened fans’ understanding, even if controversy didn’t disappear.

A team replaced their static playbook with interactive touchscreens. Film study became hands-on. Players moved icons themselves, speeding up play recognition by 15%. The screens taught them.

This kind of technological evolution mirrors how professionals refine their work in other fields. Analysts and communicators often rely on tools similar to the best essay editing platforms to polish complex ideas and make them clearer. In sports, the same principle applies—data, strategies, and insights must be refined and presented in ways players can quickly understand and act upon.

Organization Technology Implemented Key Outcome Measurable Impact
Professional Football Team Interactive Touchscreen Playbooks Transformed film study from passive to active learning 15% faster play recognition
MLS Soccer Club Catapult ViperPod Wearables Objective load management and injury prevention 22% reduction in non-contact injuries
International Cricket Board Hawk-Eye video analysis software Enhanced officiating accuracy and fan engagement 98.7% decision accuracy rate
Mid-Major College Basketball Integrated Digital Recruiting Portfolios Personalized prospect presentations wowed recruits 30% increase in top-100 recruit visits
Regional Football Academy AV-Worx Facility Overhaul with Drone Integration Improved spatial understanding during training 40% faster concept comprehension

A college basketball program without a big budget caught our eye. They used video analysis software to create personalized highlight reels. This made them the best recruiters.

The common thread in these wins? Technology used with purpose changes everything. It’s not about the latest gadgets. It’s about solving real problems.

The interactive whiteboard revolution shows this well. Coaches now work with the board, not just at it. This makes learning a dialogue, not a lecture.

These stories show three key things about sports tech success:

  • They solve specific problems (like slow play recognition or injury uncertainty)
  • They make the invisible visible (like workload data or ball trajectories)
  • They empower users, whether coaches, players, or fans

The VAR system in soccer was once doubted. Now, it’s changed how we talk about calls. The conversation is now about the data, not just guesses.

Your team doesn’t need every gadget. You just need the right video analysis software or tool for your problems. These success stories show focused innovation works, not unlimited budgets.

The final score? Sports tech that matches a team’s philosophy changes everything. It doesn’t just improve presentations. It wins games. The proof is in the stats, healthier teams, and champions holding trophies.

Practical Guide

Before you swipe that corporate card for the latest interactive display, ask yourself one brutal question: what problem am I actually trying to solve?

Most sports tech failures happen because someone bought a solution before defining the problem. Is your issue communication breakdowns? Poor visualization of plays? Or disconnected data streams? Buying VR for a team that can’t access digital playbooks is like using a flamethrower to light a candle.

Start with a ruthless audit. Gather your coaches, video staff, and equipment managers. Map out every pain point in your current workflow. This isn’t about wish lists—it’s about diagnosing bottlenecks.

Now, think like an architect, not a shopper. That beautiful 98-inch touchscreen needs more than a credit card. It needs:

  • A wall that can hold it (literally—check load ratings)
  • Network infrastructure that streams 4K video without buffering
  • Power infrastructure that won’t trip breakers during critical sessions
  • Environmental considerations like humidity control and dust protection

Source 3’s technical advice hits hard here. Dust in a gym can kill expensive projectors. Humidity in a pool area can wreck electronics. These aren’t hypotheticals—they’re budget-killers.

Your foundational AV needs (from Source 1) form the skeleton. The flashy audience engagement tech is just the skin. Build the skeleton first.

Which brings us to the most overlooked component: content management. The slickest presentation apps are useless if coaches spend hours hunting for a single clip. Your system needs:

  1. A tagged, searchable library with consistent naming conventions
  2. Template creation for recurring presentation types
  3. Access controls so the right people find the right materials fast

This is where most implementations fail. Teams buy the Ferrari but never build the garage.

So, what’s the actual installation playbook?

Phase 1: Selection. Match tools to problems, not trends. If mobile access is your gap, prioritize presentation apps that work offline on tablets. If engagement during meetings is low, look at interactive polling features.

Phase 2: Installation. Work backward from your space. Measure power outlets. Test Wi-Fi dead zones. Consider mounting solutions—permanent vs. mobile carts. Plan for cable management like it’s spinal surgery.

Phase 3: Adoption. This is the muscle memory phase. Train in small groups. Create quick-reference guides. Designate “tech champions” on staff. Make using the new audience engagement tech easier than not using it.

The goal isn’t a fancy decoration. It’s a tool that disappears into your workflow. When your quarterback instinctively pulls up last week’s interception on the touchscreen during film study, you’ve succeeded. When coaches update playbooks from their phones during travel days, the tech has become transparent.

Skip any of these steps, and you’re just creating a very expensive paperweight. Follow them, and you build a system that actually makes your team better.

Conclusion

Remember chalkboards? They used to be a key part of strategy. Now, we have cloud-based tools that are just a tap away. This change isn’t just about cleaner hands.

The right sports tech can really boost your team. It turns a coach’s instincts into solid data. It makes complex plans easy to understand, like a child’s drawing. Today’s live presentation tools are like megaphones.

Think about it. A good speech is always important. Instinct can win games. But add instant replay, interactive diagrams, and polls? That’s a winning formula. The edge is now in clear communication.

Tools like PowerPoint, Google Slides, and Keynote are now essential. They enhance, not replace, human connection. Your message travels further and your team gets it, both literally and figuratively.

This shift from chalk to digital shows a key truth. Using these tools isn’t about being flashy. It’s about being ready and understood. The chance for change is real. The old ways of communication are over.