
Walking into a room to share your vision can feel daunting. It’s like a hostage negotiation.
You have all the data and a clear plan. But, the board member is worried about money. The coach is thinking about next week’s practice. And the parent rep is already worried about fees.
This isn’t just about showing slides. It’s about understanding people. Recent news about athlete treatment is a wake-up call. Stakeholders want to be part of the planning.
Your plan isn’t just a document to approve. It’s a story that needs supporters. The future of a club depends on it. It’s about working together, not just telling people what to do.
So, how do you make your plan into a story that wins people over? We’re going to learn how to do that. This is your guide to becoming a persuasive leader in sports.
Who are the Stakeholders?
Think of your sports organization as a big movie universe. Your development plan is like a guide for everyone involved, not just the hero. It outlines the story for each character, their goals, and what they want to happen.
Before sharing your plan, you must know who will listen. These are your stakeholders: anyone who cares about your organization’s success. This includes people who are emotionally or financially invested.
We can divide the stakeholders into two groups: the Internal Cast and the External Ensemble.
The Internal Cast runs the daily show:
- Athletes & Participants: The main characters. Their story is about growing, facing challenges, staying safe, and having fun.
- Coaches & Officials: The ones who guide the story. They need clear rules, respect, and tools to help the athletes grow.
- Volunteers & Administrators: The behind-the-scenes team. They want to feel valued, have clear roles, and work in a sustainable environment.
The External Ensemble shapes the broader narrative:
- Parents & Guardians: The fans who care deeply. They want honesty, value, and a safe place for their kids.
- Sponsors & Partners: The investors. They focus on getting a good return, matching their brand, and seeing a positive impact.
- Facility Operators & The Community: The ones who make it all happen. They want easy access, good schedules, and a positive social impact.
Here’s the key point: a plan that only talks about winning will confuse the volunteers. A plan that only looks at numbers will worry the coaches.
Your first task is to understand everyone’s interests. You’re not talking to one person. You’re leading a group where everyone wants something different. A good development plan listens to everyone’s needs.
Key Elements of a Long-Term Plan
Let’s explore what makes a long-term plan effective. It’s not just about using buzzwords. It’s about building a solid foundation with purpose, precision, and growth.
First, you need a strong Mission. This is your reason for being, your “why.” Without it, your efforts are pointless.
Then, set your Goals. These are the main themes of your plan. They guide you without getting too detailed.
Next, define your Objectives. These are specific, measurable, achievable, realistic, and timely. For example, “Increase junior registration by 15% in 18 months” is a clear goal.
To achieve your objectives, you need a plan. This includes Actions, Responsibilities, Timeframes, and Resources. It’s your roadmap to success.
Modern sports science adds depth to your strategic vision. Use models like Speed Skating Canada’s LTAD. Your plan should have three main pillars.
The Social pillar focuses on keeping athletes engaged. It’s about building a community, not just a team.
The Intellectual pillar enhances your athletes’ skills and understanding. It’s about more than just physical ability.
The Physical pillar respects the science of training. It’s about improving in a way that’s sustainable and effective.
When you combine these pillars with your goal timeline, you create a powerful plan. It’s no longer just a list of targets. It’s a roadmap for growth.
Presenting this plan shows you’re serious about development. It’s not just about winning. It’s about building a better future.
This approach creates a strategic vision that’s both detailed and inspiring. It gives everyone a clear goal timeline and ensures athletes are developed fully.
Visual Roadmaps & Progress Trackers
Imagine your long-term athlete growth plan as a movie script without storyboards. It’s confusing and hard to follow. Stakeholders are not just buying a report; they’re investing in a story. Your job is to make that story visible.
The visual roadmap is the hero of this story. It turns a dense, text-heavy strategy into a clear journey. The Long-Term Athlete Development (LTAD) model is a great example. It’s not just a flowchart; it’s the hero’s journey for athletes.

The journey is clear, with each stage having its own role. From the playful start of Active Start to the skill-building of Learn to Train and Train to Train. It ends with the epic climax of Train to Win. Each stage is supported by three pillars—Social, Intellectual, Physical—showing that true long-term athlete growth is holistic.
A progress tracker is like a season-by-season recap. It makes the abstract tangible. These dashboards show the journey in detail.
- A line graph showing participant registration trends climbing toward your five-year objective.
- A simple chart marking coach certification milestones as they’re achieved.
- A bar graph where “social engagement scores” jump after implementing new team-building activities.
That last one is key. Saying “we improved camaraderie” is forgettable. But showing a graph that spikes upward is proof. It turns a soft goal into hard data.
In your presentation, these visuals are landmarks. They keep your audience on track for a decade-long journey. They show growth is happening, not just planned. A compelling visual roadmap sells the dream, but a clear progress tracker proves you’re building it. Together, they make the complex saga of athlete development into a story everyone can follow and believe in.
Making the Complex Understandable
If you’ve ever tried to explain puberty-based training windows to a skeptical parent, you know the delicate dance of making science palatable. Presenting long-term athlete growth frameworks means translating biologist-speak into sideline chatter. It’s alchemy, really.
Take the “sensitive periods of trainability.” To a physiologist, it’s elegant biology. To everyone else, it sounds like a secret society’s initiation ritual. These are the optimal biological windows for developing speed, strength, stamina, skill, and suppleness.
Your job as the sage isn’t to recite the textbook. It’s to build the metaphor.
Don’t say “the optimal window for aerobic power introduction is post-PHV deceleration.” That’s a great way to make eyes glaze over. Instead, try this: “There’s a golden age for building your child’s engine, and it’s not when you think.”
“We focus on endurance just before their big growth spurt. We’re building the base, the chassis. Then, after the spurt, we add high-intensity power. It’s like tuning a sports car after you’ve installed the bigger motor.”
Suddenly, it’s not jargon. It’s a strategy you can picture. That’s the difference between showing a blueprint and giving a VR tour of the finished house.
Let’s break down these critical windows with practical, digestible examples. The table below translates the science into actionable coaching insights.
| Athletic Quality | Sensitive Period | What It Really Means | Practical Sport Example |
|---|---|---|---|
| Stamina (Aerobic) | Just before peak growth spurt | The “engine-building” phase. Cardiovascular system is primed for base development. | In soccer: Extended small-sided games focusing on constant movement. Building the tank. |
| Strength | During and after peak growth | Muscles and tendons can handle load as they mature. The “frame reinforcement” stage. | In basketball: Bodyweight circuits, then introducing light resistance for jumping mechanics. |
| Speed | Post-growth spurt for boys; earlier for girls | Nervous system is wired for quick firing. The “software update” for fast-twitch fibers. | In track: Short, explosive sprint drills with full recovery. Quality over quantity. |
| Skill | Early childhood through adolescence | Brain plasticity is highest. The “programming” phase for motor patterns. | In tennis: Constant variety in drills—different balls, rackets, court sizes. Building the toolkit. |
| Suppleness (Flexibility) | Peak growth velocity | Muscles are lengthening rapidly. The “window of opportunity” for range of motion. | In gymnastics: Dynamic stretching woven into daily practice, not just as an afterthought. |
See? No PhD required. Each concept gets a plain-English translation and a real-world application. This isn’t dumbing down. It’s illuminating.
The intellectual pillar often gets the same muddy treatment. Don’t just list “mental fitness” as a bullet point. Paint the picture.
Describe the young speed skater who visualizes her entire race—the feel of the ice, the sound of blades, the final push—while sitting quietly before competition. She’s not just “thinking.” She’s rehearsing neural pathways. She’s managing performance anxiety by pre-loading success.
Compare periodization to managing a household budget. “You save energy here, spend it strategically there, and make big investments when the market—or the competition calendar—is right.”
This translation work is the core of stakeholder alignment. A parent doesn’t need to understand myosin filaments. They need to know why their 12-year-old isn’t doing max squats yet. A school administrator doesn’t care about hypothalamic-pituitary axes. They care about seeing a logical, phased plan that matches their academic calendar.
Making the complex understandable transforms your plan from a document into a story. It turns long-term athlete growth from an abstract concept into a shared journey. Everyone sees their role. Everyone gets the map.
And when everyone understands the route, they’re far more likely to buy the ticket for the entire trip.
Aligning with Stakeholder Priorities
Think of your stakeholder priorities as different radio stations, all tuned to the same frequency: WII-FM, or ‘What’s In It For Me?’ This isn’t cynicism—it’s human nature. Your presentation’s success hinges on answering that silent question before it’s even asked.
Every person in that room brings what Source 1 calls “rich insights based on backgrounds, lived experiences, and positions within sport.” Translation? They each have a unique lens. Your job is to show how your plan looks brilliant through every single one.
This is where strategy meets psychology. You’re not selling a plan. You’re translating a vision into the specific dialect of benefits each group understands. It’s political campaigning without the yard signs.
Let’s break down the constituency, shall we?
For the athletes, you’re speaking the language of experience. The Social pillar isn’t administrative fluff—it’s the promise of a fun, supportive peer group. The Intellectual pillar gives them mental tools for life beyond the field. The Physical pillar’s periodization? That’s their insurance policy against burnout and injury.
Parents operate on a different wavelength. Their core mandate, as noted in Source 1, is safety. But dig deeper. They want transparency in communication. They crave holistic development that builds resilient kids, not just skilled athletes who might flame out by sixteen.
Your coaches need tools, not poetry. They want the clear framework and resources that support their daily grind. Show them the professional development pathways. Demonstrate how the athlete development matrix makes their complex job more effective, not more bureaucratic.
Then there are the administrators and sponsors. They’re listening for the sound of long-term viability. Connect your dots directly to membership retention, measurable community impact, and sustainable success. These are the very reasons for planning outlined in Source 3—the “true direction of the club” that comes from consulting widely.
The magic happens when you make this alignment visible. Create a simple matrix. On one axis, list your key plan elements. On the other, list your stakeholder groups. Fill in the boxes with specific benefits.
| Plan Element | Athlete Benefit | Parent Benefit | Coach Benefit | Admin/Sponsor Benefit |
|---|---|---|---|---|
| Social Development Pillar | Supportive peer group, team bonding | Safe social environment, character building | Better team cohesion, fewer conflicts | Higher retention, positive club culture |
| Periodized Training | Reduced injury risk, peak performance | Child’s long-term health, sustainable participation | Clear seasonal structure, measurable progress | Lower liability, consistent athlete pipeline |
| Mental Skills Curriculum | Life tools beyond sport, resilience | Holistic development, academic crossover | Athlete self-management, fewer crises | Differentiated program, community reputation |
This matrix does the heavy lifting for you. It proves you’ve done the homework. More importantly, it shows you’re not presenting your plan, but their plan—a reflection of what Source 3 calls consulting “widely with members who have different expectations.”
The result? You transform possible opposition into recognized investment. When stakeholders see their priorities mirrored in your roadmap, resistance melts. They’re not being sold to—they’re being represented.
Alignment turns a presentation into a conversation. It acknowledges the diverse ecosystem of your sports organization. Remember, these stakeholders aren’t obstacles to your vision. They’re the multiple constituencies your vision must serve to survive and thrive.
Get this right, and you’re not just sharing a plan. You’re building a coalition.
Gathering Buy-In & Feedback
Presenting your plan is like writing a thesis. Gathering feedback is like getting peer review. It’s where the real work starts. This isn’t just about answering questions. It’s about gathering valuable data.
Think of it like a political poll before a big policy change. You’re testing assumptions and measuring the room’s temperature. The method you choose affects the quality of feedback you get.
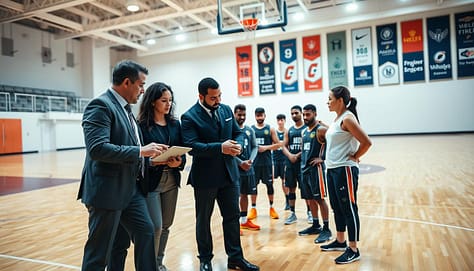
A survey gives you a wide view of opinions. A focus group dives deep into “why” questions. One-on-one interviews offer personal, unfiltered views. Each method has its role in stakeholder engagement.
The key is to listen without responding right away. Hold back and absorb what’s said. This creates a safe space for all opinions. Trust grows, and trust is key for buy-in.
At times, a neutral third party is needed. Power dynamics can affect feedback. An independent facilitator can help, showing you want honest feedback.
Choosing the right feedback method is important. Here’s how different methods compare:
| Feedback Method | Best For | Depth of Insight | Risk of Bias |
|---|---|---|---|
| Anonymous Survey | Gathering quantitative data from a large group; measuring broad sentiment. | Low to Medium | Low (due to anonymity) |
| Facilitated Focus Group | Exploring complex opinions; understanding group dynamics and “why” behind views. | High | Medium (groupthink can occur) |
| One-on-One Interview | Getting candid, personal perspectives from key individuals; sensitive topics. | Very High | Low with skilled interviewer |
| Open Forum / Town Hall | Demonstrating transparency; addressing public concerns collectively. | Medium | High (loudest voices dominate) |
| Structured Workshop | Co-creating solutions; building consensus through collaborative exercises. | Very High | Low with good facilitation |
See this phase as a strength, not a weakness. Tell stakeholders: “This is a living document. Your insights are the edits that will shape its next edition. We’re not here to sell you a finished product. We’re here to co-create the final draft with you.”
This shift from presentation to conversation makes stakeholders active owners of the vision. It’s the key to securing genuine internal project stakeholder buy-in. When people feel heard, they’re more likely to buy in. It’s both simple and complex.
Reporting Milestones
Silence in stakeholder relations is not golden; it’s harmful. You drop your plan and then hide. The silence is filled with rumors and complaints. “They never listened.” “It’s just paperwork for the grant.” This is when amateur hour ends and sports management starts.
You must close the loop with precision. Think of your milestone report as an accountability ledger for the board. It shows that your plan is alive and moving.
What goes in this ledger? First, the wins. Be a cheerleader with a spreadsheet. “Based on feedback, we’ve moved the U12 development squad to the 4 PM slot.” This shows action.
The real magic is in reporting the “no.” “We heard your concerns about the new facility fee. While the budget is locked for this fiscal year, this feedback has become our top priority in sponsor negotiations for Q3.” This doesn’t just inform; it builds trust.
Your channels are your campaign tools. Ditch the long, dry PDF. Use media your stakeholders actually watch. A 90-second video update from the Athletic Director on Instagram. A clean infographic in the monthly email. A dedicated “Plan Progress” tab on the website. This approach is not just savvy marketing; it’s essential sports management.
This process of regular reporting does something profound. It turns your static document into a season-long drama. Each update is a new episode. Stakeholders are not just an audience; they’re invested characters waiting to see how their subplot develops.
So, report relentlessly. Celebrate the victories transparently. Explain the setbacks strategically. In doing so, you silence the rumors, fuel engagement, and prove that the master plan is being executed.
Using Data to Demonstrate Progress
Data is the final, unassailable language of progress. It turns your development plan into a real-world fact. Stakeholders are naturally skeptical. You need to show them evidence so clear, it’s like a revelation.
You move from storyteller to data scientist. Traditional sports metrics are your quantitative backbone. They tell you the what. But to show the quality of your progress, you need more information.
Real-World Data (RWD) and Real-World Evidence (RWE) are key. They upgrade your data from black-and-white to full-color, high-definition video.
- Real-World Data (RWD) is raw information from routine operations. It includes feedback from surveys, sentiment analysis from forums, and attendance logs at youth clinics.
- Real-World Evidence (RWE) is the insight from analyzing RWD with traditional metrics. It shows the story behind the numbers.
For example, your plan’s “Social Pillar” aimed to boost team cohesion. The traditional metric is athlete retention rate. The RWD is your post-season survey about the “fun factor” and sense of belonging.
The magic happens. Your survey (RWD) shows a 40% increase in athletes reporting “strong friendships.” Your retention rate (traditional data) jumps 15%. The Real-World Evidence? Your Social pillar focus is making athletes happier and more committed.
Presenting this data is an art form. Ditch the dense spreadsheet. Use a simple before-and-after snapshot. Create a graph where the line for “reported enjoyment” climbs with the line for “skill proficiency.” This visual proof validates your entire process.
It shows your plan isn’t a guess. It’s a hypothesis proven daily in your club’s real-world lab. When you can point to that graph and say, “See? Our strategy is working here, here, and here,” you share a victory. That’s the ultimate power of data-driven progress.
Conclusion
Think of the last great sports documentary you watched. The magic wasn’t in the final score. It was in the shared belief that built toward it. Creating a long-term development plan is similar. It’s not just paperwork. It’s a leadership act, mixing numbers with human stories.
Your real job is to translate. You turn biological science into something your team can rally behind. This means taking data from the NFL or MLB and making it a story. You need a clear plan that shows how sports teams grow together.
Data speaks volumes, but stories sell. The NCAA’s recruiting schedules and the NBA’s player development plans are just the start. The real work is in making a living document, a dialogue. A plan stuck in a PowerPoint is useless. But one that guides your team every day can be your lasting legacy.
Don’t end with a generic “Questions?” slide. Finish with a challenge: “What’s our first chapter together?” You’ve outlined the path from possibility to success. Now, make that map a shared journey. The game plan is ready. The game is on. Go create something that will endure.