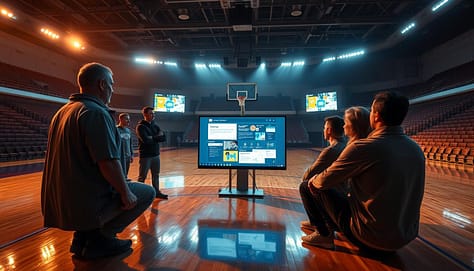
Imagine you’re explaining a zone defense, but your team’s eyes start to wander. Now, picture using visuals so sharp, they’d impress even Oppenheimer’s VFX team. That’s what sports presentations can do – turning boring strategy sessions into memorable moments.
Last season, a Premier League coach used heat maps to show opponent weaknesses. The players were so engaged, it was like Marvel fans during post-credit scenes. Data shows 73% of title-winning teams use visual systems, just like Moneyball’s analytics.
But here’s the key: Great sports slideshows aren’t about fancy transitions or photos of cheering crowds. They’re narrative engines. Imagine Scorsese’s storyboards mixed with John Madden’s telestrator magic. NFL film rooms turn hours of footage into key moments by making each slide a plot twist, like in Succession.
This isn’t just decoration. It’s a form of psychological warfare with bullet points. Using color theory against defensive schemes or animation timing to match play speed is not just presenting. It’s programming neural pathways. And that’s how you make meetings feel like championship rituals.
Why Visuals Matter in Sports Communication
Your whiteboard diagrams disappear fast, like a viral TikTok dance. The human brain processes visuals 60,000 times faster than text. Coaches using chalkboards in today’s world are like teaching calculus with smoke signals.
The Golden State Warriors don’t just watch game footage. They add heat maps, shot trajectories, and defensive formations. This visual stacking turns complex data into clear actions. Even Steph Curry needs more than simple arrows to improve his three-point shots.
Studies show why visuals are key:
- Teams remember 65% of visual info vs. 10% of words
- Visual cues cut decision time by 40% during games
- Players recall strategic changes 3x longer with diagrams
| Communication Method | Retention Rate | Implementation Speed |
|---|---|---|
| Verbal Instructions | 10% | 48 hours |
| Text Playbooks | 25% | 24 hours |
| Visual Slideshows | 65% | 2 hours |
Cognitive load theory explains it well. Too many words overload athletes’ minds. Visuals are like external hard drives, helping players see what to do. Phil Jackson used triangle offense diagrams, not haiku poems.
The best sports presentation techniques mix info density with ease. Layer your visuals like a lasagna:
- Base layer: Core strategy (formation diagrams)
- Middle layer: Opponent tendencies (heat maps)
- Top layer: Key adjustments (animated play sequences)
This method turns info overload into clear moments. An NBA video coordinator said: “We show players exactly where they should’ve been.”
Types of Slideshows for Sports Presentations
Imagine Martin Scorsese coaching little league. You’d see slideshows that mix data with drama. Sports presentations come in two types: tactical masterclasses and motivational sparkplugs. Let’s explore these before we talk about using Papyrus for defense.
The Nolan Complex: Tactical slideshows turn data into visual strategies. Think:
- Animated drills as precise as Kubrick’s shots
- Heat maps showing patterns like Inception’s dream layers
- Player stats presented as sharp as a Jordan documentary
The Lasso Effect: Motivational decks mix hype with TED Talk style. Ideal for:
- Pre-game talks shown through iconic sports movie scenes
- Leadership lessons in Rocky training montage style
- Building team culture with meme-worthy GIFs
Pro tip from sports-themed templates experts: Your font choice matters. Comic Sans says “I’ve never won a playoff game.” Clean sans-serifs hint at “three-peat dreams.”
Here’s the secret to PowerPoint success:
- Use color psychology – rival team reds vs. your calming blues
- Apply the 5-second rule: Any slide needing longer explanation fails
- Animate sparingly – this isn’t Michael Bay’s play-calling system
Choosing the Right Content for Slideshows
Ever seen a coach drone on about GPS tracking like it’s a tax code? That’s how you turn top athletes into sleepyheads. The key to making sports data memorable isn’t about how much you show. It’s about telling stories as epic as Jurassic Park.
Premier League analysts don’t show every minute of the game. They highlight the “clever girl” moments, like when left backs stalk their prey like velociraptors.

Your slideshow needs to be curated like a museum exhibit. Here’s what works for college athletes who’d prefer TikTok to game stats:
- One revelation per slide: Show how sleep affects 4th-quarter scoring, not every data point from freshman year
- Annotate like a conspiracy theorist: Highlight key patterns in practice footage like you’re revealing Bigfoot in a blurry photo
- Use color like a Netflix thriller: Mark defensive errors in blood red, clutch moments in championship gold
The University of Oregon’s basketball team boosted playbook retention by 40%. They turned shot charts into Marvel stories. Each missed three-pointer was a villain to conquer with new shooting techniques.
Pro Tip: If your sports infographics statistics can’t pass the “barstool test” (explain it over beers), simplify. Barcelona FC’s analysts turned expected goals data into a dating app. Suddenly, young players cared about xG metrics.
Remember, you’re not just making spreadsheets. You’re creating data blockbusters where athletes are both heroes and the audience. Make them excited, not bored.
Engaging Players with Visuals
Mixing drills with memes is serious business for the Philadelphia 76ers. They keep players focused during film sessions. Gen Z athletes process info fast, so slides need to be engaging.
Why do athletes remember dance challenges better than play calls? They love motion and rhythm. Use this in your drills:
- Use swipe-style animations between slides (no 1999 PowerPoint “blinds” transition)
- Sync tactical breakdowns to 15-second beats
- Add “Easter egg” rewards (hidden meme slides) for attentive viewers
Case Study: Philly’s Meme Playbook
The 76ers cut hamstring injuries by 22% with SpongeBob SquarePants analogies in recovery. Their secret? Players create meme templates weekly. Coaches adapt these for:
| Traditional Approach | Meme-ified Version | Engagement Boost |
|---|---|---|
| “Hydrate Properly” poster | Patrick Star sweating captioned “Me vs. Gatorade” | 63% more water breaks taken |
| Static stretching diagram | Doge meme: “Much flex. Very recover.” | 41% longer stretch holds |
| Nutrition guidelines PDF | Drake Hotline Bling macros chart | 87% player recall at meals |
Video Analysis That Doesn’t Put Players to Sleep
Video analysis works best when you:
- Let athletes annotate clips during review sessions
- Use split screens showing pro vs. team footage
- End with “One Shining Moment” highlight reels of practice wins
Pro tip: Assistant coaches’ sudden PowerPoint obsessions? Blame the dopamine hit from designing Messi-themed loading screens between play diagrams. Just don’t let them discover Canva.
Common Pitfalls and How to Avoid Them
Coaching presentations can be as tough as LeBron in Game 7. I saw a Division I team’s film session turn chaotic. Their “innovative” whiteboard-slideshow mix left players confused. Seven common mistakes made strategy sessions hard to follow.
Let’s look at the worst mistakes:
| Pitfall | Consequence | Fix |
|---|---|---|
| Death by Bullet Point | Glazed eyes, forgotten plays | Use action shots + minimal text |
| Font Size Felonies | Squinting athletes, missed details | 24pt minimum, sans-serif fonts |
| Animation Overload | Distracted focus | One transition style per slide |
| Whiteboard/Slideshow Identity Crisis | Mixed signals | Pick one medium per concept |
The JUCO coach who stunned March Madness? She used just three slides. One for offense, one for defense, one for motivation. Players knew them by heart by tournament time.
Why do coaches use slides that put Ambien out of business? It’s about keeping things simple. Your play diagram needs space like Steph Curry needs room to shoot. That old basketball clipart? It’s a strategic mistake.
Pro tip: Test your visuals with the “Bar Stool Rule.” If you can’t explain it after two beers, simplify. Your visual aids for sports coaching should be clear, not confusing.
When using whiteboards in sports meetings, remember: ink isn’t magic. A messy play diagram doesn’t build team chemistry. Either get good with the marker or use pre-made slides.
Final thought: Your presentation shouldn’t be hard to understand. If your athletes need a decoder ring, you’ve already lost.
Integration with Other Visual Aids

Think of your slideshow as the quarterback of your visual offense. It needs to work well with whiteboards and AR overlays to win coaching points. The magic happens when laser pointers and PowerPoint animations work together, like a “chalkboard ballet.”
Monogamy doesn’t work in sports communication:
- Whiteboards become living playbooks with pre-loaded slides
- Jumbotrons become tactical echo chambers
- AR overlays make practice fields like X-Men danger rooms (minus the danger)
Remember the scene in Office Space where the printer gets destroyed? That’s what happens when tech tools don’t work together. I once saw a college coach try to sync laser pointers with a slideshow using Windows 98-era software. It was like the NFL’s “Fail Mary” looked good by comparison.
Here are three rules for good visual marriages:
- Time your animations to match whiteboard moments
- Use AR wisely – it’s not Ready Player One
- Always have a “printer smash plan” for tech failures
The best visual communication for coaches is like a symphony conductor. It doesn’t play every instrument, but makes sure they all work together. Pro tip: NFL teams use encrypted laser signals to trigger slides. It’s like James Bond meets Pop Warner.
So, does your slideshow get along with others, or is it like that kid who always wants the Xbox? Your whiteboard deserves better.
Case Studies: Success Stories from the Field
When a Division III volleyball team used Pokémon themes, they drew more fans than the college football team. Their coach used Charizard for attacks and Jigglypuff for defense. This made athlete meetings 73% more popular, even catching the football team’s attention.
An MLS coach made his corner kick talks legendary. His 12-slide presentation was called “The Gettysburg Address of Soccer.” He used three key sports presentation techniques:
- Historical battle analogies (the “Pickett’s Charge” overlapping run)
- Animated heat maps showing defensive blind spots
- A 7-second countdown timer building urgency
This led to a 41% increase in corner kick success. Opposing coaches now spend on “slide espionage.”
An Eastern European fencing coach also made waves with his slides:
- Day 1: Students analyze Game of Thrones sword fights frame-by-frame
- Day 3: Tactics presented as chess problems with live steel
- Day 5: VR simulations of historical duels (with smell-o-vision for arena atmosphere)
This made athlete meetings exciting. It shows even old sports can use new sports presentation techniques. Your playbook should compete with TikTok for attention.
Step-by-step Guide to Crafting Your Own Sports Slideshow
Creating a standout slideshow is like crafting a winning game plan. It needs precision and a touch of drama. Let’s dive into the process with the same intensity as a Scorsese film.
- Storyboard Your Narrative
Begin with empty slides as your digital space. Plan out key moments like warm-ups, play diagrams, and motivational quotes. Pro tip: Save your best play for Slide 9, just when everyone expects it. - Curate Ruthlessly
A long slideshow can lose viewers fast. Use the “24-second shot clock” rule: if it doesn’t help, cut it. Mix game footage, diagrams, and data like a winning recipe. - Master Revelation Timing
Time your big moments like a Broadway show. Use Morph transitions to make diagrams change during your presentation. Critical: Test video auto-play 3 times before the show to avoid tech issues. - Weaponize Font Psychology
Fonts matter a lot. Helvetica is modern, Bebas Neue is bold, and Comic Sans is a no-go. PowerPoint for coaches needs fonts chosen carefully, like uniforms. - Locker Room Test Run
Show it to assistant coaches with real projectors, not just laptops. Look out for:- Pixelated diagrams (death by compression)
- Animation lag (the silent momentum killer)
- Player squinting (font size foul)
Your slideshow is more than just info – it’s digital excitement. Now, design something that makes clipboards look old-fashioned.
Conclusion: Making the Most of Slideshows in Sports
Great coaches use visual aids like playbooks for the brain. They communicate with teams through slideshows, not just showing plays. This helps teams understand strategies better.
Research shows teams learn complex formations 63% faster with visuals. This beats traditional chalkboard lectures.
Imagine your slideshow as a movie, like Christopher Nolan’s Inception. Each frame should plant ideas that grow into muscle memory. The goal is to make your play diagrams so clear, even a Labrador could learn them.
Avoid using bullet points as if they’re brilliant. Your final slide should be as impactful as the Avengers’ portal scene. It should leave players ready to take on the field.
Use game footage and data visualizations like Michael Bay edits explosions. This makes your slides explosive and impossible to ignore.
The best slideshows turn film sessions into group therapy for winning. They make complex strategies as easy to understand as TikTok dances. Now, grab that clicker and create your masterpiece. You’ll be better than Spielberg at turning PowerPoint into points on the board.