Category Archives: Presentation Basics

Storytelling in Sports Presentations: SCQA, PREP, and Locker-Room Narratives

In the high-stakes sports world, victory is not just about physical skill. Leaders must influence key decision-makers and unite their people. Whether pitching a new strategy or rallying before a big game, winning over stakeholders is key.

Data and statistics give us the facts. But to truly persuade and align a group, a powerful narrative is needed. This turns information into a mission people can emotionally support.

A compelling narrative is key for motivation. It rallies everyone around a common goal. It also drives culture building, creating a shared identity and core values.

The core idea is clear: facts tell, but stories sell and inspire. Mastering this art makes the difference between good and legendary leaders.

Why stories stick: emotion + schema + action

Forget dry stats and generic pep talks. The most impactful team messages are built on a specific recipe. Cognitive science shows that a story becomes unforgettable when it engages three core mental processes: emotion, schema, and action. This combination creates a compelling narrative arc that players internalize and act upon.

Emotion is the hook. Data is processed by the brain, but emotion is *felt* by the person. A story that sparks joy, tension, empathy, or shared pride creates a chemical marker in the brain. This makes the information attached to it more memorable. Think of a coach showing a clip of a rookie’s first fumble, not to shame, but to highlight the determined practice that followed.

The audience feels the struggle and the triumph, cementing the lesson of resilience far more effectively than a bullet point ever could.

Schema is the mental filing cabinet. Our brains organize new information by fitting it into existing frameworks, or schemas. A great sports story takes a complex concept—like defensive rotation—and links it to a simple, familiar idea, like a synchronized dance. By connecting the new play to an existing mental model, you make it instantly understandable and easier to recall.

This is why using structured narrative frameworks works; they provide a familiar schema for both the storyteller and the listener.

Action is the inevitable conclusion. The final, critical element is a clear direction. The emotional journey and the clarified concept must point toward a specific, desirable behavior. This is the “what do we do now?” moment. A story about a last-second win built on flawless communication logically culminates in a call to focus on signal clarity in the next practice.

It translates the lesson into a tangible step, making powerful visual storytelling tools incredibly effective for driving this point home.

When you weave these three threads together, you create more than a recap. You build a complete cognitive experience. The emotion ensures the message is salient. The schema ensures it is comprehensible. The action ensures it is applicable. This is the anatomy of a story that sticks—a true narrative arc that moves from context, through conflict, to a resolution that demands a response.

Frameworks: SCQA, PREP, and a “mini hero’s journey” for game week

Effective storytelling in sports isn’t about sudden ideas. It’s about using reliable frameworks. These structures make your message strong and easy to remember.

Start with the SCQA method. It helps organize a persuasive argument.

  • Situation: Set the context. “We are a team built on defensive discipline.”
  • Complication: Show the problem. “Our last three games showed a lapse in second-half focus.”
  • Question: Ask the main challenge. “How do we maintain intensity for the full 90 minutes?”
  • Answer: Offer your solution. “By implementing a new communication protocol in the final 30.”

SCQA makes a complex issue clear and solvable.

For quick, impactful messages, use PREP. It’s great for halftime talks or pre-practice briefs.

  • Point: State your main idea upfront. “We need to own the midfield today.”
  • Reason: Explain why. “Controlling that space cuts off their primary attack route.”
  • Example: Show evidence. “Look at the tape from Tuesday. Every time we pressed high, we won possession.”
  • Point: Restate your conclusion. “So, midfield dominance is non-negotiable.”

PREP makes your point clear and convincing.

The hero’s journey is a powerful template. For a game week, you can make a “mini” version.

This creates a compelling story arc from Monday to Sunday.

1. The Call to Adventure (The Challenge): Early in the week, frame the upcoming game as a defining challenge. It’s not just another match. It’s a test of character, a rivalry renewed, or a chance to prove a point. This sets the stakes.

2. The Trials (Preparation & Struggle): The days of practice are the trials. Highlight the hard work, the film study, the tactical adjustments, and the physical grind. Show the struggle. This builds empathy and shows the path to growth.

3. The Transformation (The Game Itself): Game day is the moment of transformation. This is where the lessons from the trials are applied. The narrative culminates in the performance, where the team seeks to return changed—with a win, a lesson learned, or a standard met.

Mapping a game week to this mini hero’s journey gives coaches a powerful template. It transforms a schedule into a story. Players aren’t just preparing; they are protagonists on a quest.

Using SCQA for problem-solving, PREP for clear instruction, and the hero’s journey for motivational narrative provides a complete toolkit. You move from sharing information to crafting an experience.

Building blocks: conflict, stakes, evidence, call to action; ethical use of hype

Real motivation in sports comes from stories that mix challenges, risks, proof, and a clear goal. These elements turn a simple message into a strong reason to take action.

First, create a meaningful conflict. This is the main challenge your team faces. It could be a tough rival, a weakness in stats, or a personal challenge. A clear conflict gives everyone a common enemy to focus on.

Next, talk about the real stakes. What’s at risk? Is it a championship, a legacy, or personal pride? Stakes should be both emotional and real. They answer the “why” for every player, making the goal urgent and important.

Your story needs credible evidence. Use data and history to back your message. Mention specific past wins, stats, or trends—just like analysts rely on local representative voting records to build trust through verifiable facts. Evidence turns hope into belief, showing the goal is reachable, not just imagined.

End with a clear call to action. This is the direct instruction needed now. Instead of “play hard,” say “win every 50-50 ball in the first ten minutes.” A strong call to action gives a clear plan.

A diverse group of athletes in a motivational huddle, standing in a well-lit indoor sports facility. In the foreground, a passionate coach with a clipboard and whistle enthusiastically addresses the team, emphasizing the stakes of the upcoming game. The athletes, dressed in smart athletic uniforms, display focused expressions, showcasing determination and resolve. In the middle ground, teammates lean in closer, some placing their hands together in a gesture of unity, capturing the intensity of the moment. The background features a vibrant sports environment with banners and team colors, enhancing the energy. Use a dynamic angle to create a sense of depth, with natural lighting highlighting the intensity of the scene, evoking an atmosphere of collaborative spirit and purpose.

These parts create excitement, or “hype.” Used right, hype is a great tool for culture building. But, it must be real. False claims or promises harm trust and lead to doubt.

Good hype focuses on real abilities and proven success. It highlights true strengths and acknowledges challenges. Honesty is key to building lasting trust. A team driven by truth is stronger than one fueled by lies.

Studies on hype and trust show credibility is essential. In teams, it means lasting motivation. Leaders who are truthful build cultures where everyone fully commits.

This method of culture building ensures energy comes from a shared reality. It creates an environment where everyone is on the same page. The result is a team excited for the whole season, not just one game.

Assets: archival photos, player quotes, micro‑docs, behind‑the‑scenes B‑roll

Your story’s framework is just the start. It’s the real-life assets that bring it to life. Sports storytelling comes alive with visuals and sounds. These elements connect with your audience on a deeper level.

Each asset has its own role. Used right, they turn a simple presentation into an unforgettable experience.

Archival Photos and Footage connect us to the past. A vintage championship banner or a video of the team’s first game adds history. It shows the journey from struggle to success.

Raw Player and Coach Quotes add realness. A quarterback’s words about nerves before a game are more moving than a narrator’s. Their genuine emotions and tone speak directly to us.

Micro-Documentaries share personal stories of triumph and hardship. A short video about a rookie’s comeback or a veteran’s last season is deeply moving. They highlight the core of your story.

Behind-the-Scenes B-Roll offers a peek into the unseen. Footage of team prep, bus rides, or the equipment manager’s work adds depth. It makes us feel like insiders, building respect for the team’s daily efforts.

Getting these assets needs a proactive plan. Don’t wait until the last minute to start collecting.

  • Build Relationships Early: Connect with team archivists, media staff, and video teams. They hold the keys to history.
  • Always Be Recording: With permission, capture moments during practice, meetings, and events. The best B-roll is often unplanned.
  • Conduct Targeted Interviews: Ask open-ended questions to get emotional, memorable quotes. “How did that moment feel?” is better than “Were you happy?”
  • Repurpose Existing Content: Use documentary series, pre-game features, and social media for clips and quotes that fit your story.

Using these assets well is key. Start with archival material to set the scene. Insert quotes at emotional peaks to validate your words. Use micro-docs to highlight key points. B-roll under narration keeps visuals engaging and real.

This careful use of assets makes your presentation stand out. It proves your story and makes it feel real. By mastering these elements, you turn your communication into powerful sports storytelling.

Script kit: openers, transitions, closers; timing and silence

Timing and silence are key in sports storytelling. They make your words powerful. This section is your guide to crafting great stories. It includes templates for openers, transitions, and closers.

It also covers the importance of pacing and pause. These non-verbal tools control the story’s rhythm.

These techniques boost your motivational impact. They help you connect with your audience deeply.

A dynamic sports storytelling script kit positioned on a stylish wooden desk in a well-lit locker room. In the foreground, an open notebook with vibrant handwritten notes and a digital tablet displaying a timeline of key moments in a game. In the middle ground, colorful sticky notes labeled "opener," "transition," and "closer," alongside a stopwatch and a whistle, representing timing and silence. The background features neatly arranged sports gear, such as jerseys and trophies, creating an immersive atmosphere. Soft, diffused lighting highlights the textures of the pages and objects, evoking a sense of preparation and creativity. The angle captures the essence of a focused, passionate storyteller ready to inspire through sports narratives.

The first ten seconds are critical. A strong opener grabs attention and sets the tone. Avoid generic greetings. Instead, use these proven approaches.

  • The Provocative Question: “What does it take to look fear in the eye and not blink?” This engages the listener’s reflection.
  • The Vivid Scene-Setter: “The clock is frozen at zero, the stadium is silent, and all the work of the last year comes down to this single moment.” It drops the audience into the drama.
  • The Bold Declaration: “Tonight, we aren’t just playing a game; we’re defending a legacy.” This frames the event with purpose and urgency.

Each opener type serves a different purpose. Choose one that matches your message and desired emotional response.

Opener Type Example Best Use Case Emotional Target
Provocative Question “When was the last time you left everything on the field?” Pre-game player huddles, captain’s speeches Introspection, personal challenge
Vivid Scene-Setter “Imagine the roar as you step onto the court for the final match.” Fan hype videos, season trailer narration Anticipation, immersion
Bold Declaration “This season is about one thing: redemption.” Season kick-off events, press conferences Unity, shared mission
Personal Anecdote “I remember the first time I saw this team practice; the hunger was palpable.” Alumni events, coach’s addresses Authenticity, connection

Engineering Seamless Transitions

Transitions connect your story’s ideas smoothly. They keep the flow going without losing momentum. A bad transition can ruin the story’s impact.

Use phrases that link your ideas. For example, after talking about failure, say: “But failure is just data. And that data led us to a new plan…” This turns failure into a positive step.

Another great technique is the “call-back.” Reference something from your opener later. This creates a satisfying, cohesive story.

Designing Memorable Closers

Your closing statement is what people remember. It should reinforce your message and inspire action. Avoid vague wishes like “Let’s have a good game.”

Effective closers often:

  1. Reiterate the Core Theme: Briefly echo your main message in a fresh, concise way.
  2. Issue a Clear Call to Action: Tell them exactly what you want them to do or remember. “When you step on that line, I want you to think of one word: ‘together.'”
  3. Project into the Future: Paint a quick picture of the desired outcome. “Let’s go write the final chapter of this story.”

A strong close leaves no doubt about the next step, emotionally or physically.

Mastering Timing and Pacing

Pacing controls your story’s rhythm. Strategic timing builds suspense and highlights key points. Speed up for energy and urgency in action sequences. Slow down for complex strategies or poignant moments.

This variation keeps the audience engaged. It prevents boredom and emphasizes key points. Think of it as a camera zooming in for a close-up.

The Power of Purposeful Silence

Silence is a powerful tool in sports storytelling. A well-placed pause does three things. It lets a point sink in. It creates tension before a big reveal. It shows the speaker’s authority.

Use a two to three-second pause after a provocative question or statement. This lets the audience process and feel the words’ weight. Silence, used well, speaks volumes. It turns a speech into a conversation with the audience’s thoughts.

Together, these elements form a complete script kit. They help you deliver dynamic, compelling, and motivational stories. Practice using openers, transitions, closers, timing, and silence. Your delivery will become as impactful as the story itself.

Evaluate impact: sentiment polls, behavior change, performance ties

The most powerful locker-room story means little if its impact remains a mystery. Move from anecdotal feeling to concrete evaluation. This turns narrative art into a strategic tool.

Start with quick sentiment polls. Use simple digital tools like Slido or a show of hands after a presentation. Gauge the emotional reception. Did the story resonate? Did it build connection?

Look for tangible behavior change. Observe the team’s energy in the next practice. Listen for players repeating key phrases from the talk. Note shifts in collective body language and effort.

Where possible, tie storytelling to performance metrics. Analyze if narrative themes correlate with improved focus during critical game moments. Track team cohesion scores over a season.

This data-driven approach allows for refinement. It shows what narratives work and why. It transforms communication from a guess into a guided process.

Ultimately, this cycle of implementation and measurement proves storytelling’s value. It demonstrates how strategic narrative work fuels long-term culture building. This process links the emotion of a story to the tangible results of sustained success, making culture building a measurable outcome.

Data Visualization for Coaches: Turn Stats into Decisions

Today’s coach is surrounded by numbers. They deal with everything from player load metrics to game performance stats. The real challenge isn’t just collecting this data—it’s understanding it.

Powerful visuals help clear the confusion. They turn complex spreadsheets into clear, compelling stories. A well-designed chart does more than show numbers. It grabs attention, shows you’ve put in the effort, and builds trust with your team.

This is about strategic communication. You might want to show an athlete their progress or explain a tactical change to your staff. The right visual, chosen with purpose, turns raw statistics into useful insights. It shapes training plans, game strategies, and development paths.

Being good at this skill makes you a great leader. This guide will teach you to use visuals to make decisions. For a detailed look, check out our 10-step data viz guide.

Data to Decisions

In sports analytics, the most powerful visual is useless if it doesn’t answer a specific question for a specific person. Coaches swim in data, but making a game-changing decision requires a deliberate process. It starts with two foundational questions.

What decision does this information support? And who needs to understand it? Answering these questions shapes everything that follows.

This “know your purpose” step is critical. Are you visualizing to prove a player’s improved efficiency to them? Or to show a tactical weakness to your staff? The goal dictates the design. A chart for an athlete focuses on personal progress. A report for the front office might compare value across the entire league.

Your audience is just as important. A head coach needs high-level, strategic takeaways. An assistant might need drill-specific details. The athlete themself benefits from clear, personal feedback. Great sports analytics visuals are tailored for their viewer.

Raw numbers lack meaning. Their power comes from context. This is the “compared to what?” principle. A player’s scoring average is just a number. But compared to the team average, it shows contribution. Compared to their own last season, it shows growth. Compared to the league’s top performers, it reveals a gap.

Embedding data within the right context transforms reporting into insight. It moves from “what happened” to “why it matters and what we should do.” The table below outlines this decision-driven framework.

Primary Purpose Intended Audience Key Context Question Sample Insight
Show Individual Performance Athlete Compared to their own past performance? Player’s sprint speed has increased 5% from pre-season.
Demonstrate Team Trend Coaching Staff Compared to league average or key rivals? Our defensive efficiency ranks 3rd in the conference.
Evaluate Training Load Sports Scientist & Coach Compared to planned vs. actual workload? Week 3 load spiked 20% above plan, risking fatigue.
Plan Strategy for Next Opponent Entire Staff Compared to opponent’s historical weaknesses? Opponent allows 40% more shots from the left wing.

This structured approach turns data into a decision-making engine. Visualizations become tools for examining performance, planning strategies, and pinpointing improvement areas. They stop being just reports and start being conversations.

The right sports analytics visuals act as the perfect vehicle for these comparisons. They make complex relationships clear and immediate. This mindset shift—from data delivery to insight generation—is what separates reactive coaches from proactive ones.

Once your purpose and audience are set, you can choose the right chart type with confidence. The next step is learning how to present your insights clearly to drive action. Effective visuals lead directly to adjusted practice plans, new rotations, and smarter in-game choices.

What to Visualize: KPIs by Sport (Efficiency, xG, Load, Wellness)

Before starting, coaches must decide which metrics are most important. The right data visualization focuses on the right KPIs for the sport and athletes.

Choosing the wrong data leads to confusion. The right KPIs turn numbers into clear, actionable insights. This choice is the first and most important step.

We can group essential KPIs into two broad categories. The first is for measuring in-game performance and tactics. The second is for monitoring athlete health and readiness.

Team Sport Performance KPIs

For sports like basketball, soccer, and hockey, efficiency metrics are key. These numbers show how well a player or team converts opportunities into results, much like how mindfulness and meditation resources help individuals improve focus and performance over time.

Simple percentages, like shooting accuracy or pass completion rate, offer a solid foundation. They answer basic questions about skill execution.

Advanced metrics like Expected Goals (xG) provide deeper tactical insight. xG evaluates the quality of a scoring chance. It helps coaches understand if a player’s goal tally is sustainable or lucky.

Visualizing these efficiency KPIs highlights strengths and exposes weaknesses. It guides decisions on player selection, tactical adjustments, and practice focus.

Athlete Monitoring and Load KPIs

The second category is vital for athlete health and long-term development. It involves tracking both external and internal load.

External load measures the physical work done. This is where GPS tracking excels. Wearable devices capture data like total distance, sprint speed, and high-intensity efforts.

Coaches use this GPS tracking data to quantify training intensity. They can ensure athletes are not under-prepared or pushed toward injury.

Internal load measures how an athlete feels. This is captured through RPE dashboards and wellness questionnaires.

Players rate their perceived exertion (RPE) after a session. They also log sleep quality, muscle soreness, and mood. This subjective data is critical.

When combined, external and internal load create a complete picture. A sudden spike in GPS metrics paired with poor wellness scores is a major red flag. This holistic view is essential for modern athlete management.

Sport Context Key Performance Indicators (KPIs) Primary Purpose Common Data Sources
Team Sports
(Soccer, Basketball)
Shooting Percentage, Expected Goals (xG), Pass Completion Rate, Turnover Ratio Evaluate tactical effectiveness and player efficiency in competition. Game footage, play-by-play statistics, sport-specific tracking software.
Individual Performance
(Track, Swimming, Gymnastics)
Speed, Endurance Capacity, Technique Consistency, Power Output Optimize individual athlete output, refine technique, and track progress. Timing systems, video analysis, force plates, coach observations.
Athlete Monitoring & Load Management Training Load (GPS data), Internal Load (RPE dashboards), Wellness Scores (Sleep, Soreness) Balance workload with recovery, prevent overtraining, and reduce injury risk. Wearable GPS devices, athlete self-reporting apps, heart rate monitors.

The table above provides a clear starting point. Your sport will dictate which column is most relevant. Often, you will need to visualize KPIs from multiple categories.

For example, a soccer coach might look at a player’s xG alongside their high-speed running distance from GPS tracking. A fatigued player may start making poor tactical decisions.

Remember, good visualization practice means being selective. Do not show every metric you collect. Choose KPIs that directly relate to the specific decision you need to make. This focus turns a dashboard from a data dump into a decision-making tool.

Chart choices: when to use shot charts, heat maps, bar/line, scatter with zones

Choosing the right chart is key to good data visualization. The wrong chart can confuse your message. The right one makes your insight clear.

Think of these charts as tools in your coaching toolbox. Each one is designed for a specific job.

  • Shot Charts and Heat Maps answer “where” questions about spatial patterns.
  • Bar Charts and Line Charts help compare values and track changes.
  • Scatter Plots with Zones categorize players based on two key metrics.

Shot charts are great for analyzing scoring attempts. They show where every shot is taken. This reveals a player’s best and worst shooting spots. It answers, “Where are we most and least effective offensively?”

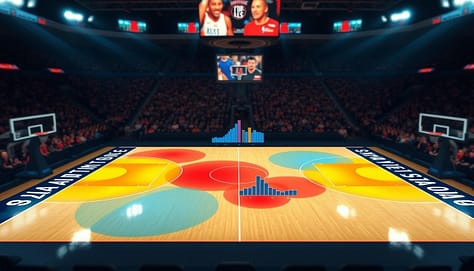
Heat maps show density and intensity. They use colors to highlight where players spend most time or where action is intense. A soccer heat map can show if a midfielder is in the right spots. A football heat map can highlight collision areas. They answer, “Where is the action concentrated?”

A visually striking and informative shot chart heat map visualization serves as the centerpiece of the image, showcasing a basketball court layout with colorful, overlapping zones indicating player shot locations and frequencies. The foreground features heat maps in vibrant reds and blues, highlighting areas of high and low shooting efficiency. In the middle ground, blended bar and line graphs illustrate comparative shooting statistics, seamlessly integrated into the court design. The background displays a soft-focus arena ambiance, with blurred crowds, enhancing the perception of an active game environment. Dramatic lighting casts shadows across the court, emphasizing the importance of data visualization in coaching strategies. The overall mood is insightful and professional, designed to inspire coaches and analysts in interpreting performance metrics effectively.

Bar charts are perfect for simple comparisons. They make it easy to see who has more or less of something. Use them to compare points per game or tackle counts. They answer, “Who has more or less of this stat?”

Line charts are great for showing trends over time. They plot a metric like team wellness scores or average possession time. This shows progress, decline, or cycles. The connecting line makes the trend clear. It answers, “How is this metric changing?”

Scatter plots with zones are powerful for player profiling. They plot athletes on two axes like speed vs. strength. Then, divide the plot into zones. This instantly categorizes players into groups. It’s perfect for combine analysis or tailoring training. It answers, “How do our athletes cluster based on these two traits?”

Choosing the right chart is a strategic decision. It ensures your data tells the story you need your team to see and understand.

Avoiding traps: cherry-picking, small n, dual axes, misleading color scales

Excel and Sheets make charts easy to create, but they can lead to traps. These traps can misrepresent athlete performance. A chart should show the truth, not hide it. This section guides you on how to create ethical and effective visualizations.

Great visualizations follow a core rule: show the data. Avoid charts that summarize too much, like “dynamite plots” with just averages and error bars. They hide the individual data points. Always ask if your chart lets the raw information speak.

Another critical practice is to display uncertainty. No metric is perfect. Showing confidence intervals or ranges builds trust. It tells your athletes and staff that you understand the limits of your analysis.

Let’s break down four specific traps that can compromise your message.

Cherry-Picking Data

This happens when you select only data that supports a pre-existing bias. For example, showing only games where a player shot well to argue they are in a “hot streak.” It ignores contradictory evidence.

To avoid this, set your analysis timeframe before looking at the data. Use consistent periods, like a full season or a defined training block. Transparency is your best defense.

The Small ‘n’ Problem

Drawing big conclusions from a tiny sample size is a classic error. Making rotation decisions based on three games of data is risky. The results are not stable and can change wildly with more information.

Always note your sample size on the chart. Be cautious with advice when ‘n’ is small. Wait for more data or use metrics that are reliable with fewer observations.

Dual Axes Distortion

Using two different Y-axes on one chart can suggest a relationship that isn’t real. Plotting player fatigue scores on one axis and scoring efficiency on another might make lines appear to move together. This can be an illusion created by the scale.

If you must use dual axes, make the relationship clear. Better yet, use two separate, aligned charts. This prevents the brain from making false connections.

Misleading Color Scales

Color should highlight what’s important. A default red-to-green scale might make small, meaningless differences look dramatic. This can misdirect attention away from the key insights.

Use color intentionally. Sequential scales (light to dark) are best for ordered data. Diverging scales (like blue-white-red) highlight deviation from a median. Avoid rainbow scales as they can imply false categories.

Trap What It Is Common Example in Sports How to Avoid It
Cherry-Picking Selecting only data that confirms a belief. Only showing a player’s top 10% of performances to argue for a starting spot. Pre-define analysis windows. Show full context.
Small ‘n’ Small sample size leading to unreliable conclusions. Changing a drill because it “failed” in one practice session. Annotate sample size. Seek larger datasets.
Dual Axes Two different scales distorting perceived relationships. Charting workload (high numbers) and wellness score (low numbers) together. Use separate charts or a correlation scatter plot.
Misleading Color Color scales exaggerating unimportant differences. A heat map using a fiery red for a 51% success rate and calm blue for 49%. Use perceptually uniform color palettes. Label clearly.

Tools like Excel and Sheets often encourage these traps with their defaults. The standard dual-axis chart wizard, for instance, makes it a one-click option. The common color palettes may not be suitable for all data types.

Your job as a coach is to make conscious design choices. Override the defaults. Your goal is accuracy above all else. A truthful visual, even if simpler, is far more powerful than a flashy misleading one.

By avoiding these traps, you build a reputation for integrity. Your team will trust the numbers because they trust how you show them. This turns data into a tool for genuine decision-making, not just confirmation.

Tools: Excel/Sheets templates, Tableau/Power BI basics, Hudl data exports

The journey from data export to dashboard starts with a good tool. Coaches don’t need to be tech experts. They just need to know the basics.

This guide will show you where to start based on your program’s needs and your tech skills.

A sleek, modern workspace showcasing various data visualization tools specifically designed for coaches. In the foreground, an open laptop displays a colorful, interactive dashboard made with Tableau featuring sports analytics and player stats. Beside it, a printed Excel template with vivid charts and graphs for tracking player performance. In the middle, an elegant tablet shows a Hudl data export with intuitive visualizations. The background features a blurred office setting with soft natural light filtering through a window, enhancing a professional atmosphere. The overall mood is one of focus and insight, ideal for empowering coaches to make data-driven decisions. The image should be captured with a slight tilt angle to emphasize the tools and their potential impact on coaching strategies.

Excel and Google Sheets are great for many programs. They are easy to use and have templates for sports data. This makes creating charts and graphs simple.

These tools let you quickly turn practice logs and stats into visual reports. They’re perfect for team meetings or reports for parents.

Business intelligence platforms like Tableau and Power BI are better for big data. They connect to many data sources. This lets you make interactive dashboards that coaches can explore.

Imagine a dashboard where you can click on a player to see their stats. Or filter a heat map for second-half defense. This makes reports interactive and useful.

Connecting these tools to your sports data pipeline is key. Platforms like Hudl export detailed data. This data feeds into your visualization tools.

This makes the process smooth: from game capture to insights. No more typing numbers into spreadsheets. The system does the hard work, so you can focus on analysis.

Be platform agnostic. Choose tools that fit your current needs. Start with simple tools like Google Sheets. As you grow, you can move to more advanced tools.

Begin with what works now. Build confidence with one tool before adding more. The goal is clear communication, not mastering software.

Slide integration: one insight per visual; annotation rules; color legends and callouts

A powerful visualization loses its impact if it’s buried in a cluttered slide. The final step is integrating your chart into a coach-friendly report or pre-game presentation. This stage is about communication, not just creation.

Your goal is to ensure a coach can grasp the key takeaway in seconds during a busy meeting. Proper slide design applies core visualization principles directly to the coaching context.

The One Insight Per Visual Rule

Avoid cognitive overload. The most effective slides follow the one insight per visual rule. If a single chart is trying to show player efficiency, fatigue trends, and positional coverage, it will confuse more than inform.

Instead, create separate visuals for each major point. This focus forces clarity and makes your argument stronger. A coach reviewing a deck should instantly know what each slide is proving.

Maximize Data-to-Ink and Remove Clutter

Apply the principle of maximizing the data-to-ink ratio. Remove any element that doesn’t directly support the core insight. This includes unnecessary gridlines, redundant legends, and decorative backgrounds.

Increase whitespace around your chart. This gives the visual room to breathe and draws the eye directly to the data. A clean, uncluttered layout signals professionalism and confidence in your findings.

Don’t make your audience hunt for the story. Label key data points directly on the plot. If a bar is critically high, put the number on top of it. If a data point is an outlier, circle it.

Use callout boxes or arrows to highlight the main takeaway. A short, bolded sentence next to the chart can serve as the verbal punchline you’d deliver in a meeting. Effective annotation acts as a guide.

  • Label Directly: Place text and values on the chart itself.
  • Use Callouts: Highlight the “so what” with a text box.
  • Integrate the Legend: Often, you can make the chart title your legend (e.g., “Player Sprint Distance: High = Red”).

Strategic Color and Accessibility

Use color legends strategically. If a color scale is essential, keep it simple and place it close to the data. Better yet, use intuitive colors that don’t require constant reference back to a legend.

Always consider accessibility. Use color-blind-friendly palettes (like viridis or plasma) to ensure your message is inclusive. Color should enhance understanding, not create a barrier.

Mastering slide integration turns data into decisions. It’s the bridge between your analysis and a coach’s actionable insight. A well-designed presentation earns trust and accelerates the path from stat to strategy.

Case studies: practice plan changed by GPS heat; rotation tweak from shot chart

A GPS heat map and a basketball shot chart are more than simple graphics. For two coaches, they were game-changers. They turned raw numbers into clear visuals that changed practice plans and game strategies.

A collegiate soccer coach looked at the team’s weekly load report. It showed total distances and high-speed runs, but the story was unclear. Then, she saw the GPS heat map of a recent training session.

The heat map showed a big problem. Drills were mostly on the right side of the pitch. Players on the left were doing less and at lower intensities. This made the uneven workload clear.

The coach quickly saw the issue. Some midfielders were always overloaded, while others on the left were underused. This put some players at risk of injury and others unprepared.

The coach made a simple but effective change. She made the drills more balanced across the field. She also changed where drills started to ensure everyone got a fair workout.

This change made the player load more even. The next week’s heat map showed even intensity. This change helped the team perform better and stay healthy.

Case Study 2: The Shot Chart That Changed the Rotation

A high school basketball assistant was looking at a recent loss. The team’s shooting was poor. He made a shot chart for the starting wing player.

The chart showed a clear problem. The player was taking too many contested long-twos from the left baseline. His makes were mostly in the right corner and on drives from the top of the key.

The chart made it clear where the player was good and where he wasn’t. The coach had a solid fact, not just a feeling, about shot selection.

The coach decided to make a small change. He proposed subbing the player out two minutes earlier in the first quarter. This way, the player would join the second unit, which ran sets that favored corner three-point attempts on the right side.

This change led to more shots from the player’s best zones. It improved his efficiency and the team’s offense. It turned a weakness into a strength.

Case Study Impact Summary
Scenario Data Source & Visualization Key Insight Revealed Coaching Decision Measurable Impact
Soccer Training Load GPS Data; Heat Map Overlay Uneven workout intensity across the field Redesigned drill layouts for symmetry Balanced player load; reduced injury risk
Basketball Shooting Efficiency Play-by-Play Data; Shot Chart Player’s shots clustered in low-percentage zones Adjusted rotation and play calls Increased shot quality from preferred areas

These stories show how data can lead to winning decisions. In both cases, a coach moved from numbers or intuition to a visual. This led to clear insights and confident actions. The tools and principles discussed are practical and effective.

Downloadable dashboard starter

Data visualization turns numbers into stories and stats into plans. It changes raw GPS data into a new practice plan with the right tools.

We want to give you the power to make decisions with data. So, we’ve made a downloadable dashboard starter. It’s ready to use in Google Sheets or Excel.

This tool lets you see important metrics like player load and wellness scores. It’s your first step to interactive dashboards that engage everyone.

This template helps you tell data stories effectively. It helps you focus on what matters, like the strategies for memorable sports data. You can see trends and patterns easily.

Start using this template to apply your data insights. Turn your data into visuals that guide your decisions. Your next big idea is just a click away.

Visual Aids that Work: Slides, Diagrams, and Clips for Coaches and Managers

Explaining a complex playbook or quarterly data can be tough. You have important info, but if your team doesn’t get it, your plan fails.

Cognitive science has a solution. The Dual Coding Theory says people learn better with words and pictures. Studies show this method can improve understanding by up to 400%.

Also, people remember about 65% of information shown with visuals. This is way more than the 10% they remember without visuals. It’s not just about looks; it’s about making your message last.

For sports and business leaders, three tools are key: good slides, clear diagrams, and powerful video clips. They turn hard stats and complex systems into clear, memorable insights.

Learning to use these tools turns a basic briefing into a strong coaching moment. It’s how you make raw data into something your players or stakeholders can act on.

Design principles: contrast, alignment, repetition, proximity; sports color palettes and fonts

Good sports visual aids rely on clear contrast, smart alignment, consistent repetition, and logical proximity. These four core design principles, known as CRAP, make slides powerful coaching tools. They help athletes focus on what’s important.

Let’s explore each principle with examples from sports.

Contrast makes differences clear. It’s used to highlight a player’s route or a defensive gap. High contrast colors, like white on dark blue, are easy to read from afar. Always check contrast ratios for accessibility.

Alignment brings order. When player icons are on a grid, your diagram looks professional. Every element should connect visually. This prevents slides from looking messy.

Repetition creates consistency. Use your team’s colors, logos, and fonts in all presentations. This repetition strengthens your brand and makes materials easy to recognize.

Proximity groups related items. Place a statistic next to the player it describes. This rule makes your slide clear and easy to follow.

Choosing the right color palettes is next. Start with your team colors and build a palette for clarity. Use color theory: complementary colors make elements pop, while analogous colors create harmony.

About 8% of men have color vision deficiency. Avoid bad color combinations like red-green or blue-purple for important info. Use texture or labels as a backup. A consistent color scheme is key to making sports data memorable.

Font selection is about visibility and tone. Stick to one or two bold, sans-serif typefaces. Sans-serif fonts, like Arial or Helvetica, are easy to read on screens. Avoid thin, script, or overly decorative fonts.

Use font size to create hierarchy. Your main play title should be largest. Supporting points should be smaller. This visual guide directs attention smoothly.

Design Principle Primary Goal Sports Application Example
Contrast Create visual distinction and highlight importance Using bright yellow to mark a receiver’s path on a dark green field template
Alignment Establish order and a professional structure Lining up all defensive player icons along a shared baseline on a court diagram
Repetition Build consistency and reinforce branding Using the same team logo, color strip, and font on every slide in a playbook
Proximity Group related information logically Placing a player’s season stats directly beneath their photo in a recruitment presentation

Using these design principles as a system is essential. They work together. Good alignment enhances proximity. Strong contrast benefits from strategic repetition. Mastering these basics makes your sports presentations authoritative. Players and staff will trust the information because it looks clean and intentional.

Your visual aids should explain, not confuse. A solid design foundation ensures they do exactly that. Now you’re ready to build specific diagrams and clips with confidence.

Diagrams: court/field templates, spacing indicators, icon sets; when to animate vs static

Tactical diagrams are key in sports strategy, linking ideas to action. Studies show diagrams can boost understanding by 89% over text alone. For coaches, a clear play diagram is essential for teaching.

It turns complex ideas into simple, visual instructions players grasp right away. This section will guide you in creating better visual playbooks.

Begin with accurate court and field templates. These are the base for your tactical diagrams. You can find templates online or make your own in software like PowerPoint or Canva.

Make sure the proportions match your sport. A basketball court template should include the three-point line and key accurately. A football field needs correct hash marks.

Using a standard template helps everyone see the same strategy. It prevents confusion before you draw the first line.

Next, add spacing indicators and icon sets to show player positions and movement. Spacing indicators are lines, arrows, or shaded zones that highlight key distances between players.

For example, a dashed circle can show a defender’s needed distance. Icon sets use standardized symbols for players, balls, and equipment.

Consistency is key. Always use a triangle for a quarterback and a circle for a wide receiver. This creates a universal visual shorthand your team learns quickly.

Choosing between static and animated play diagrams is a big decision. Static diagrams are great for reference materials, like printed playbooks or pre-game handouts.

They are perfect for showing a final formation or a snapshot of a critical moment. Static diagrams are simple, quick to make, and easy to share.

Choose animation for showing timing, sequence, and flow. An animated diagram can illustrate a player’s cutting route, the pass progression, or a defensive rotation.

Tools like PowerPoint’s Morph transition can make a play diagram come alive with smooth movement. Animation is powerful for explaining dynamic plays where “when” is as important as “where.”

Use the following table as a guide to decide between static and animated visuals for your coaching needs.

Factor Static Diagram Animated Diagram
Best Use Case Reference sheets, printed playbooks, quick reminders Demonstrating timing, sequence, and player movement flow
Creation Speed Fast and simple to produce Requires more time and technical skill
Player Comprehension Excellent for memorizing formations and positions Superior for understanding dynamic plays and reactions
Delivery Format PDF, printed paper, static slide Digital presentation, video file, interactive screen
Key Advantage Clarity and simplicity for a single moment Shows cause, effect, and progression over time

Remember, the goal is always clear communication. A complex animated sequence can sometimes confuse more than it clarifies. If a static diagram with clear icons and spacing indicators does the job, use it.

For illustrating a multi-phase play where movement is everything, animation is your best tool. SmartArt and other diagram tools in presentation software help visualize complex concepts without overwhelming your audience.

Build your library of templates, icons, and indicators. Your play diagrams will become more effective and efficient to create. This saves you time and makes your team smarter.

Video: clip length, slow‑mo, telestration layers, captioning best practices

Mastering video analysis is more about using best practices than fancy equipment. Video is key for breaking down technique and connecting with your team. You need a clear plan for length, playback, annotation, and clarity.

Keep Clips Short and Purposeful

Attention spans are short, even during intense film sessions. Experts say keep instructional videos under 90 seconds. This keeps focus sharp and ensures your main point is clear.

Show only the necessary clip. For example, if analyzing a three-second decision, don’t play the whole 30 seconds. Tell your audience the video length and use it effectively in your talk. This saves time and makes your message stronger.

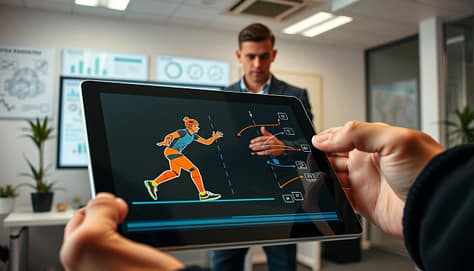
A dynamic scene depicting a digital telestration in action. In the foreground, a sleek tablet screen shows layered annotations illustrating the movement of a sports player in slow motion, highlighted by vibrant colors that contrast with the dark screen. In the middle ground, a professional coach stands intently analyzing the screen, wearing smart casual attire, surrounded by detailed charts and diagrams on a large monitor behind them. The background features a well-lit office space, subtly decorated and conveying a productive atmosphere. The lighting is bright yet soft, creating a focused ambiance. The perspective is slightly angled, enhancing the sense of engagement and interaction with the digital tools at hand while maintaining a clean and professional look without any text or distractions.

Slow-motion is great for technical analysis, but use it wisely. Use it for moments that are hard to see at full speed. Showing the play at full speed first helps set context, then slow-mo for the key moment.

Harness the Power of Telestration

Telestration makes video analysis interactive. It lets you draw on video frames to highlight important points. Modern software allows you to draw on a transparent layer, keeping your original footage safe.

You can use layers for different elements like highlighting defenders or offensive routes. This keeps the screen clear and lets you focus on what’s important. A good telestration tool is essential for real-time coaching.

Captioning for Universal Clarity

Never assume everyone will hear the audio clearly. Gyms are loud, and headphones aren’t always available. Clear captions ensure your analysis is understood everywhere. Use a large, legible font and keep captions short and accurate.

By using short clips, strategic slow-mo, dynamic telestration layers, and clear captions, you turn raw footage into a compelling coaching story. For coaches, exploring the latest broadcast tech innovations at IBC can reveal new tools to simplify the process.

Demo tools: PowerPoint morph, Keynote Magic Move, Canva brand kit, Google Slides; Hudl/KlipDraw/Coach Paint overlays

Let’s dive into the world of software, comparing everyday tools with special overlays used by top teams. Your toolkit has two main parts: general design tools for telling your story and sport-specific tools for deep analysis. Knowing both helps you smoothly move from studying film to discussing strategy with your team.

For making your main presentation, you’ll use tools like PowerPoint, Keynote, Canva, and Google Slides. They have advanced features that make showing play progressions easy. Microsoft PowerPoint’s Morph transition is a big help. It smoothly changes objects, text, and shapes between slides.

Apple Keynote has a similar feature called Magic Move. It automatically makes animations between slides where objects have the same name. This is great for showing how players move or a defensive shift changes. Canva’s Brand Kit is also key. It saves your team’s colors, logos, and fonts. Then, you can easily keep every slide and graphic consistent.

Remember, good design is key, no matter the platform. Use the 5-5-5 rule: no more than five words per line, five lines per slide, and five text-heavy slides in a row. Animations should reveal information or show motion, not just for fun. Always choose big, easy-to-read fonts so everyone can see.

Platform Standout Feature Best For Collaboration
Microsoft PowerPoint Morph Transition Detailed, stepwise play animation Excellent (via 365)
Apple Keynote Magic Move Smooth object-based animations Good (iCloud)
Canva Brand Kit Maintaining visual consistency quickly Strong real-time editing
Google Slides Simplicity & Access Quick edits and universal sharing Superior real-time collaboration

The second part of your toolkit includes special software like Hudl, KlipDraw, and Coach Paint. These tools are for the film room. They let you draw on game footage. You can make dynamic overlays that show:

  • Precise player pathways and spacing.
  • Defensive coverage shells and rotations.
  • Annotated frames with arrows, highlights, and text.

With KlipDraw or Coach Paint, you can create professional drill diagrams or add them to a video. Then, you can add this analysis to your main presentation. Export a clear, annotated video or a static diagram. Embed it in your PowerPoint or Keynote slide. This connects the tactical concept in your slideshow with real-game evidence from your film.

This mix—using Canva for branded slides, PowerPoint for animations, and Hudl for detailed annotation—makes a strong coaching presentation. It turns raw game footage into a compelling strategic story for your team.

Hardware: clickers, timers, laser vs on‑screen cursors; HDMI/USB‑C adapters checklist

Even the best visual aids can fail if the tools to show them don’t work. This part is about the physical tools needed to present your ideas. We’ll talk about the key equipment that helps you control your presentation.

Good hardware lets you focus on your message and your athletes. It keeps technical issues from ruining your session.

A well-organized coaching presentation hardware checklist displayed on a modern conference table. In the foreground, neatly arranged items include a wireless clicker, digital timer, HDMI and USB-C adapters, and a sleek laser pointer. The middle section features an open laptop with a presentation slide visible, surrounded by color-coded sticky notes and a cup of coffee to create a productive atmosphere. In the background, soft-focus elements like a whiteboard with inspirational diagrams and a bright window streaming natural light enhance the setting. The lighting is warm and inviting, with an emphasis on clarity to highlight each item. The overall mood is professional and focused, perfect for a coaching or managerial context.

Handheld presentation clickers give you freedom. You can move around while advancing slides. This keeps your audience engaged more than being stuck to a laptop.

Built-in software timers are useful for explaining drills. But, a dedicated physical timer is often more reliable. It works on its own, not tied to your slides.

For sessions that need to be on time, use both. Have a backup timer on a separate device. This is a smart backup plan.

Highlighting Key Points: Pointer Options

Choosing how to highlight on-screen is important. You have two main options: the traditional laser pointer or your mouse’s on-screen cursor.

Each method has its own benefits for different coaching situations. The table below shows the pros and cons to help you decide.

Feature Laser Pointer On-Screen Cursor
Precision & Visibility Excellent for large screens and rooms. Creates a bright, visible dot. Can be precise but may be hard to see from a distance. Requires a steady hand.
Presenter Mobility Allows full room movement. You are not tied to the computer. Typically requires you to stay near the laptop to use the touchpad or mouse.
Ease of Use Simple point-and-click. No software setup needed. Integrated into your computer. No extra device to carry or lose battery.
Best For Large team meetings, gymnasiums, pointing at physical objects on a screen. Smaller meetings, detailed software demonstrations (like drawing plays in Hudl).

The Non-Negotiable Adapter Checklist

The most common presentation problem is a connection issue. You can’t assume the venue’s projector will match your laptop. Always carry your own adapter kit.

Practice connecting your own gear before the session. A quick test can prevent a major delay.

Pre-Presentation Connectivity Checklist:

  • HDMI Adapter: The current standard for high-definition video and audio.
  • USB-C to HDMI/VGA: Essential for modern MacBooks and many Windows laptops.
  • Legacy VGA Adapter: Often found in older projectors and school facilities.
  • Extension Cable: A 6-foot HDMI or VGA cable provides extra reach.
  • Power Strip & Charger: Make sure your laptop and clicker are fully charged.
  • Backup Plan: Have your presentation saved on a USB drive and accessible via cloud storage.

Go through this list before every meeting. When using video analysis tools like Hudl, check if your laptop can output the video feed smoothly through the adapter.

Great coaching communication needs smooth execution. Your hardware choices make this possible. Invest in reliable tools, check them before, and always have a backup plan.

Slide library setup and tagging

Your final step is building a legacy system. A well-organized slide library saves time. It also reinforces your coaching message every season.

Start by creating a centralized, cloud-accessible folder. This becomes your single source for every diagram, video clip, and statistic. Use a consistent naming convention for files.

Implement a logical tagging system. Tags like “4-3 Defense,” “Out-of-Bounds Plays,” or “2024 Season” let you find assets instantly. This is key for diagrams created in tools like Coach Paint.

Integrate all your visual assets into this system. Whether you use Coach Paint for detailed play diagrams or another tool, including the latest CAD design tools, store the final versions here. Consistent tagging ensures nothing gets lost.

This workflow guarantees version control. You always present the latest play design. It also maintains visual consistency across all team meetings and recruit presentations.

A disciplined library turns your hard work into a reusable asset. You stop recreating slides and start refining your game plan instead.

Setting Clear Objectives for Sports Presentations: From “Inform” to “Install”

For years, many believed that if they built something, people would automatically come. But that’s not true anymore. Places like Los Angeles’ Staples Center show that success comes from planning and setting clear goals for different people and making money.

Your talks need a clear start too. A good presentation does more than share facts. It should help your audience go from just knowing something to actually doing something new.

This move from knowing to doing is key to good communication. Without a clear plan, you might lose your audience. Having presentation goals is like having a map. It shows you exactly what you want to achieve.

The SMART objectives framework helps turn vague dreams into real plans. It makes goals Specific, Measurable, Achievable, Relevant, and Time-bound. This clear structure is widely used in goal-setting and performance management research, including frameworks discussed by SMART goals framework, helping make presentations more memorable and impactful.

Objectives That Stick

A great sports presentation does more than share info; it aims for a specific goal. Goals like “update the team” or “inspire everyone” are too vague. They lead to presentations that miss the mark. To make a real impact, you need a clear plan.

This plan is a list of presentation goals. It starts with simple data sharing and goes to changing behavior and organizations. Knowing your goal helps you craft every slide and story for the best effect.

Taxonomy: Inform, Align, Decide, Train/Install, Motivate, Fund/Approve

Think of these six levels as a ladder of influence. Each step needs a different strategy and measures success in its own way. Your main goal should be on one rung.

  • Inform: Sharing data or knowledge without needing action right away. Example: Presenting quarterly performance analytics to the board.
  • Align: Building consensus or a shared understanding around a strategy or idea. Example: Getting coaches, players, and staff to agree on a new defensive philosophy.
  • Decide: Helping make a choice between clear options. Example: Leading a committee to pick a new equipment vendor or software platform.
  • Train/Install: Teaching a new skill, system, or process with the expectation of implementation. Example: Introducing a new playbook, teaching volunteers a new registration software, or installing a revised strength and conditioning protocol.
  • Motivate: Raising emotional energy and commitment toward a future goal. Example: A pre-season pep talk to athletes or a volunteer appreciation event to boost a community campaign.
  • Fund/Approve: Getting resources, budget, or formal authorization. Example: Asking for a facility upgrade to city council or capital for new training technology.

It’s key to pick your single, primary objective. A presentation trying to do too much will fail. Knowing what you want is your first step to success.

This method is like how top organizations set learning outcomes at every level. Take the USA Football Development Model. It doesn’t just aim to “develop players.” It has stages like “Discover and Play” and “Play and Develop.”

Each stage has clear, measurable goals for physical, technical, tactical, mental, and social-behavioral development. These are the exact learning outcomes for each phase. A presentation for parents of “Discover and Play” athletes has a different goal (likely to *inform* and *align*) than a clinic for “Train to Compete” coaches (focused on *train/install*).

Look at strategic plans like Tualatin Parks and Recreation’s. The framework starts with Values and Vision and goes to specific, measurable Objectives. This is a taxonomy in action, moving from a big vision (“a vibrant community”) to a clear goal (“increase program participation by 15%”).

For a sports administrator, your vision to “build a premier youth academy” must break down into specific goals. You might need one to fund/approve the budget, another to align the coaching staff, and another to inform parents. Each presentation targets a different learning outcome for its audience.

By using this taxonomy, you ensure your message is clear and impactful. You define the desired learning outcomes first, and then your stories, data, and slides follow from that clarity.

Taxonomy: inform, align, decide, train/install, motivate, fund/approve

Let’s dive into making goals that are clear and effective in sports. Knowing your goal is just the start. The next step is to write the goal in a way that’s clear and leads to action.

Two key frameworks are SMART criteria and CLEAR framework. SMART focuses on individual goals for accountability. CLEAR is better for team goals in sports. Knowing both helps you choose the right framework for your needs.

A professional sports presentation setting, focusing on the theme of SMART objectives. In the foreground, a confident presenter in formal business attire stands confidently next to a digital presentation screen displaying visuals of the SMART objectives framework. The middle layer features a diverse audience of engaged individuals, both men and women, in semi-formal attire, attentively listening and taking notes. The background includes subtle visual elements like charts and graphs on the wall, promoting an atmosphere of collaboration and goal-setting. Soft, focused lighting highlights the presenter, creating an inspiring and motivational mood. The scene is captured from a slightly elevated angle, emphasizing the dynamic exchange of ideas. The overall tone is professional and optimistic, suitable for a sports presentation setting.

Applying SMART Objectives in Sports Contexts

SMART stands for Specific, Measurable, Achievable, Relevant, and Time-bound. In sports, these elements help set clear goals for improvement.

Specific goals aim for exact skills or results. For example, USA Football’s Functional Development Model sets skills for each stage. This is better than a vague goal like “improve catching.”

Measurable goals make it easy to check progress. A coach-training goal might be to have 100% of coaches show three key points of the ‘Ready Position’ by the end. You can see if they’ve done it.

Achievable goals match the athlete’s or team’s current level. It’s not good to ask a beginner team to do a hard play. Goals should fit with the program’s bigger goals.

Time-bound goals add urgency. “Increase team fundraising by 15% before the season opener” has a clear deadline.

The goal of “install” objectives is to change behavior. A well-written SMART objective makes this change clear and verifiable.

Taxonomy Level SMART Objective Example Key SMART Element Highlighted
Inform “After this briefing, 100% of athletes will correctly list the three new safety protocols for concussion management.” Measurable, Specific
Align “By the next practice, the leadership council will co-create and agree upon a written set of five team culture norms.” Time-bound, Achievable
Decide “Following this review, the athletic board will vote to approve one of the three proposed off-season training schedules.” Specific, Relevant
Train/Install “By the end of this session, each coach will successfully run the new tackling drill, with all players demonstrating proper head placement.” Time-bound, Measurable (focus on behavior change)
Motivate “This pep talk will result in 90% of players self-reporting a confidence level of 8/10 or higher for the upcoming rivalry game.” Measurable, Achievable
Fund/Approve “This proposal will secure a commitment from the city council for 50% of the facility upgrade costs within the next fiscal quarter.” Time-bound, Specific

Introducing the CLEAR Framework for Team Goals

While SMART is great for individual goals, sports are about teamwork. The CLEAR framework—Collaborative, Limited, Emotional, Appreciable, Refinable—is better for team goals.

  • Collaborative: The objective needs team input. “The coaching staff will jointly design a new playbook section” is collaborative.
  • Limited: It is scoped and bounded. “Improve communication between the offensive and defensive units during the next two scrimmages” is limited.
  • Emotional: It connects to the team’s passion or values. An objective to “reclaim our identity as the hardest-working team in the league” taps into emotion.
  • Appreciable: It can be broken into smaller, quick-win steps. A large goal like “host a successful regional tournament” is appreciable when divided into tasks like securing venues, finalizing schedules, and launching registration.
  • Refinable: It can be adjusted as conditions change. In-season goals often need refinement due to injuries or performance shifts.

Major sports event planning, like for the Commonwealth Games, uses CLEAR-like thinking. Objectives for economic impact or facility legacy are collaborative (involving multiple stakeholders) and refinable (adapting to budgets and timelines).

Using SMART and CLEAR together makes strong, multi-layered objectives. A SMART objective gives a clear goal. The CLEAR lens adds team involvement and flexibility. For example, a “fund/approve” objective might be SMART in its financial target and timeline, but CLEAR in its team effort with community partners.

The main goal is to have clear outcomes. Whether using SMART, CLEAR, or both, aim for specific targets that guide your presentation and program.

SMART + CLEAR outcomes for sport contexts with examples

The secret to a presentation that truly changes behavior is not in the first slide. It’s in a methodical planning sequence that starts with the end in mind. Creating a SMART or CLEAR objective is just the beginning. The real magic happens when you use that objective to build your entire session.

This approach, called backward design, flips traditional planning on its head. Instead of gathering information first, you start with the change you want to create in your audience.

Backward Design: Objectives → Assessment → Content Selection → Slide Plan

Backward design is a four-stage process that ensures every element of your presentation serves your ultimate goal. It’s the methodology behind elite coaching frameworks like USA Football’s Football Development Model (FDM) and strategic plans like the Tualatin Master Plan.

The FDM’s structure is a masterclass in this logic. It starts with the long-term goal of athlete development and works backward to create the specific stages, skills, and training activities needed to reach it.

  1. Define the Objective: What should your audience know, do, or feel by the end? Be specific. Use your taxonomy (inform, align, decide, etc.) and the SMART/CLEAR frameworks from the previous section.
  2. Determine the Assessment: How will you know they got it? This isn’t a final exam. It could be a quick show of hands, a practice demonstration, a group decision, or a short post-session survey.
  3. Select the Content: Only choose information, stories, data, and drills that directly enable success on that assessment. Anything else is clutter.
  4. Build the Slide Plan: Structure the flow to deliver that essential content in the most engaging and logical sequence.

This method is your best defense against information dumping. It guarantees that every minute of your talk has a purpose.

Consider a coaching session on a new play install. A forward-design approach might start with the playbook diagram. Backward design starts differently. The objective is clear: “Coaches will be able to verbally walk through all five player assignments for the ‘Zebra’ stunt by the end of this 20-minute session.”

The assessment? Each coach will role-play explaining the stunt to a position group. The content selected is now hyper-focused: the exact assignments, common mistakes, and a key visual cue. The slides are built to reinforce just those points.

On a macro scale, the Tualatin Master Plan process explicitly follows this backward logic. It starts with Values and Vision (the “why”), then defines Goals and Objectives (the “what”), before ever moving to Recommendations and action plans (the “how”). Your presentation should mirror this same airtight logic.

By locking in your objective first and designing backward, you move from simply sharing information to architecting understanding and driving real-world action.

Backward design: objectives → assessment → content selection → slide plan

Success signals turn a one-way lecture into a dynamic engine for lasting behavior change. The backward design process goes beyond picking content and slides. It ends with adding ways to check if your goal is met, in real-time and after the presentation.

Think of a major sports event. Its success isn’t just about ticket sales on game day. It’s about long-term impact, legacy, and benefits to stakeholders. Your presentation should have the same mindset. You must define what success looks like and how you’ll know you’ve achieved it.

Success Signals: Your Real-Time Navigation System

These are built-in checkpoints that tell you if your audience is with you and on track to apply the learning. For objectives aimed at installing a new skill or changing a habit, these signals are non-negotiable. They turn passive listening into active engagement.

Check-Backs: The Pulse of Understanding

Check-backs are simple, interactive pauses. They gauge comprehension and keep energy high. A coach might say, “Turn to a partner and explain the new defensive rotation in your own words.” This does two things. It reinforces learning for the speaker. It also reveals gaps in understanding for the presenter.

Micro-Assessments: Quick and Insightful Feedback

These are fast, low-stakes evaluations woven into the session. In a team meeting, use a quick poll: “Show of hands—who feels confident executing the new play call?” For skill-based training, a 30-second demonstration is a powerful micro-assessment.

This mirrors the tools used in athlete development. Programs like USA Football use Stage Development Checklists. Coaches don’t wait for a season-end review. They use ongoing checklists to provide continuous feedback and adjust training on the fly.

A futuristic office space in a corporate environment, highlighting a diverse group of three professionals engaged in a dynamic brainstorming session. In the foreground, a woman in a smart blazer gestures while pointing towards a digital display showcasing performance graphs and success metrics. The middle section features a whiteboard filled with flowcharts and colorful post-it notes related to "behavior change success signals" and "micro assessments." In the background, large windows allow natural light to flood the room, casting soft shadows. The atmosphere is one of collaboration and focus, with cool tones and modern design elements, captured from a slightly elevated angle for a comprehensive view of the scene. Ideal lighting emphasizes the energy and engagement of the meeting.

This is the most critical signal. It’s the plan to move the learning from the presentation room into real-world action. A talk on leadership is only successful if captains demonstrate new communication behaviors at the next practice.

To engineer this transfer, be specific. Instead of a vague “use this later,” create a simple action plan. “Before our next film session, each position group will identify one example of this technique from last game’s footage.” This closes the loop between theory and application.

The table below contrasts these three core success signals, helping you choose the right tool for your objective.

Signal Type Primary Purpose Example in Sports Context Success Metric
Check-Backs Verify comprehension & foster engagement “Summarize the new recovery protocol for your teammate.” 90% of participants can accurately summarize the key point.
Micro-Assessments Gather quick feedback & identify gaps Live poll: “Rate your understanding of the new league rules from 1-5.” Identify the 20% of the room that needs immediate clarification.
Transfer to Practice Ensure real-world application and behavior change Action item: “Implement the new warm-up routine at tomorrow’s practice and report back.” The new routine is consistently used by the team one week later.

Integrating these signals requires forethought. In your slide plan, literally block out time for a check-back after a complex concept. Design a micro-assessment slide before a major decision point. Your final slide should never be “Questions?” It should be the clear, actionable first step for transfer to practice.

By measuring facility and event performance, the sports industry knows that true impact is long-term. Adopt that standard for your presentations. Build the measurement into the design itself. When you do, you stop just informing people and start installing lasting change.

Success signals: check-backs, micro-assessments, transfer to practice

Starting to execute your plan, time management is key to success. You have clear goals and know how to check on them. Now, it’s time to make room for success signals to show up.

What are success signals? They show if your message is getting through. A check-back question checks if people understand. A quick test shows if a concept is clear. Seeing knowledge used in practice is the best sign.

These moments don’t happen by chance. They need careful planning in your schedule. A packed schedule with too much talking leaves no time for interaction. To meet your presentation goals, plan your time like an event manager plans a tournament.

Agenda architecture: 10/20/30 rule for coaches

Forget the old 90% talk, 10% Q&A model. The 10/20/30 rule is better. It focuses on doing more than talking. This rule splits your time into three parts:

  • 10% – Connection & “Why”: This is your hook. It grabs attention with a problem, story, or question. It builds relevance and interest. For a strong start, build confidence to deliver well.
  • 20% – Content & “What”: Here, you share new info, models, or data. Keep it short and simple. Use clear visuals and easy explanations.
  • 70% – Practice & “How”: This is the main part. It’s for applying what you learned, discussing, rehearsing, and planning. This is where skills grow and decisions are made.

This structure fights against just listening. It makes room for checks and quick tests that show learning. Just like managing a big event needs meticulous scheduling, your presentation goals need this detailed plan.

The rule is also adaptable. Your main goal decides what the 70% practice zone focuses on. A “Decide” meeting might debate and build consensus. A “Train/Install” session focuses on skill practice and feedback. This matches research on skill transfer, which stresses doing it.

By using the 10/20/30 rule, you create an experience for your team, not just present at them. You turn your meeting into a chance for action and understanding.

Agenda architecture: 10/20/30 rule for coaches

You have your goals and ways to measure success. Now, create a presentation that shows them off. The 10/20/30 rule is simple: 10 minutes for the start and setting the scene, 20 minutes for the main content, and 30 minutes for practice and discussion. This plan keeps your audience engaged and focuses on doing, not just talking.

Worksheet: Write 3 Objectives and Map Slides to Them

Make your plan a reality. Use this worksheet to make sure you cover what you need to.

Start by picking a real presentation you have to give. Figure out its main goal—is it to teach, align, or train? Write down one main goal using SMART or CLEAR criteria. For example, “By the end of the session, 100% of coaches will show they can do the new tackling drill right.”

Then, think of two or three ways to check if people understand. Quick polls or practice sessions are good ideas.

Next, follow the 10/20/30 rule. Make a detailed plan for your 20-minute core block. Use this time to teach the most important concepts linked to your goal.

Lastly, match your slides or activities to each part of your plan. Each slide should help meet one of your objectives. This method, like the Tualatin Master Plan or USA Football’s stage guides, makes sure every minute counts toward your goals.

This worksheet helps you plan better. Your presentations will go from just sharing info to making real changes.

Know Your Room: Players, Parents, and Stakeholders—Different Decks, Same Goal

Every successful communication strategy has one key rule. You must know who you’re talking to. Treating everyone the same is a big mistake, even in complex places like youth sports.

Picture a critical business meeting. Unexpected stakeholders show up late. This could mean they’re ready to support, oppose, or negotiate. The smart thing to do? Don’t just stick to your plan.

Instead, reach out to them first. Learn about their views and influence before you start. This is true for working with players, parents, and board members.

Good audience analysis is more than just a formality. It’s a constant effort to gather information. Your aim is to make sure your message hits home and moves everyone towards a shared goal.

Personas: Player (18–25), Youth Parent, Athletic Director/Board, Sponsor/Booster

Understanding the four main groups in youth sports is key. Just like the educator’s card game, your meeting works best when you know each group’s needs. Each brings their own views, problems, and goals.

Creating these personas is your first step. It makes sure your message hits home and everyone works together.

The Player (Aged 18-25)

This group lives two lives. They focus on sports and also grow as young adults. They deal with school, work, and personal growth.

They want to be seen by scouts and improve their game. They also care about being part of a good team. Their main worries are playing time, coaching, and how sports affect their future.

Talking to players should be clear, lively, and respect their time. They want to know the program’s direction and their role in it.

The Youth Parent

For youth parents, the game is about their child’s safety and happiness. They worry about safety, cost, and value.

They look for a well-rounded experience for their child. They want character growth, fun, and support. They manage schedules and finances.

Their biggest fears are bad coaching, injuries, and money issues. Talking to parents should be reassuring, informative, and focus on the child.

The Athletic Director or Board Member

This group faces a lot of pressure. They manage budgets, facilities, and the school’s image. They see the big picture, focusing on keeping the program going and managing risks.

They aim for financial health, success in sports, and good community standing. They balance resources with results. Their main concerns are avoiding lawsuits, keeping students enrolled, and keeping sponsors.

When talking to ADs and board members, use facts and figures. Emphasize the benefits, like saving money and building a strong reputation.

The Sponsor or Booster

Sponsors look for a good deal. They invest and expect something in return. It’s a partnership, not just charity.

They want their brand to be seen in a positive light. They seek networking chances and marketing benefits. They want their logo seen by families.

They ask, “What’s in it for me?” Talk about how their support helps their business, like reaching new customers and building goodwill.

Persona Primary Goal Key Concern Communication Priority
Player (18-25) Athletic development & future opportunity Playing time, coaching quality, visibility Direct, transparent, and empowering
Youth Parent Child’s safety, growth, and enjoyment Cost, safety, and positive environment Reassuring, informative, and child-focused
Athletic Director/Board Program sustainability and institutional success Budget, liability, and reputation Data-driven, strategic, and risk-aware
Sponsor/Booster ROI and community brand alignment Exposure, network access, clear value Benefit-oriented, professional, and partnership-focused

Knowing these four personas is not just for fun. It’s the key to making messages stick, building trust, and working together. When you talk to what each group values, you turn different people into a united team.

Information needs and fears per group; language and tone shifts

A player, a parent, a board member, and a sponsor meet. Your success depends on speaking their language. Everyone wants the program to thrive, but their questions and fears differ greatly. You must understand these needs and fears and adjust your tone.

Imagine a CFO, an operations VP, and a procurement officer. They all have different needs. So do your athletic stakeholders. By understanding their views, you can connect with them. For more on this, check out our guide on understanding your audience and connecting with players, parents, and.

The Player (18-25): Aspiration and Anxiety

Young athletes dream of growth and opportunities. They want clear feedback on their performance and a path to success. They’re interested in drills, schedules, and how to get more playing time.

But they also fear stagnation, injury, or not being good enough. This fear can make it hard for them to listen to anything else.

Language & Tone Shift: Speak to their dreams and ambitions. Use direct and motivational language. Avoid jargon and focus on gaining a competitive edge. Your tone should be energetic and supportive, seeing challenges as chances to grow.

The Youth Parent: Transparency and Trust

At a parent meeting, parents want honesty above all. They need details on costs, safety, and fair play. They’re investing in your program with their time, money, and child’s well-being.

They fear hidden fees, unfair coaching, or their child being overlooked or hurt. They need to know the program is safe and caring.

Language & Tone Shift: Be reassuring, detailed, and empathetic. Give specifics and avoid legal terms. Talk about security and value. Saying “here is our safety plan” builds trust better than vague promises.

The Athletic Director or Board Member: Compliance and Metrics

Administrators focus on strategy. They need data on enrollment, budget, liability, and outcomes. They must justify the program to superiors or a board.

They fear budget cuts, legal issues, poor performance, or community backlash. A mistake could cost funding or their job.

Language & Tone Shift: Use a strategic, data-driven, and formal tone. Lead with KPIs. Talk about ROI, risk, and compliance. Show the numbers behind your passion.

The Sponsor or Booster: Engagement and Value

Sponsors seek a return on their investment. They want metrics on audience engagement, brand visibility, and goodwill. They want to see how their money brings value.

They fear being linked to controversy or ignored. They worry about their brand being damaged by scandal or neglect.

Language & Tone Shift: Focus on partnership and value. Highlight demographics, social media, and success stories. Emphasize co-branding and community impact. Your tone should be professional and enthusiastic, highlighting mutual benefits.

Your program’s message remains the same. But how you present it must change. By addressing each group’s needs and fears, you create meaningful conversations. This is the art of understanding your audience before you speak.

Pre‑work: RSVP forms, pulse polls, knowledge baselines

Before you meet, you’ve already started to understand your audience. This early work turns a generic talk into a meaningful conversation. It’s about getting key information to make your message hit home.

Think of pre-work as showing respect. It means you value people’s time and thoughts. It also helps you tackle real issues, not just guesswork.

RSVP Forms: Your First Intelligence Tool

Don’t just see RSVP forms as a headcount tool. View them as a way to listen strategically. A good form asks not just if someone will come, but why.

Add fields like:

  • “What one question do you hope this meeting answers?”
  • “What is your primary role related to this topic?”
  • “What outcome would make this session a success for you?”

This change gives you a sneak peek of what’s on people’s minds. You can spot common themes and plan your talk to address them directly.

A well-organized, professional workspace featuring an athletic director's pre-work survey setup. In the foreground, a sleek wooden table is adorned with neatly arranged RSVP forms, pulse polls, and knowledge baseline documents, all in muted colors for a sophisticated look. In the middle ground, a large digital tablet displays a colorful data visualization summarizing feedback trends, while a laptop is open, showcasing a spreadsheet of survey results. The background reveals a conference room with soft natural light filtering through large windows, casting gentle shadows. The atmosphere is focused and collaborative, inviting a sense of preparation and engagement among stakeholders. The space is free from distractions, reflecting a professional ambiance suitable for strategic planning.

Some topics, like new safety rules or fee hikes, can stir strong feelings. A quick, anonymous poll via email or app helps gauge the mood.

Ask one or two direct questions:

  • “On a scale of 1-5, how comfortable are you with the proposed new practice schedule?”
  • “What is your biggest concern regarding the updated travel policy?”

Knowledge Baselines: Leveling the Information Field

Experts and newcomers are in the same room. Starting from scratch bores the veterans. A knowledge baseline helps.

This is a quick, non-judgmental test sent before the meeting. For example, before discussing new concussion rules, ask three questions on basic terms.

The results show how familiar everyone is with the topic. You know if you need to explain basics or dive into details. This ensures everyone understands and shows the athletic director board’s commitment to clear communication.

Using these three pre-work tools greatly improves meetings. They start with shared understanding, not confusion. Discussions are focused, and attendees feel heard from the start. This proactive approach is key for a leader who understands the room before anyone speaks.

Room read tactics: cold-open questions, show-of-hands, QR polls

Effective facilitators don’t just present; they engage in real-time audience analysis. They watch who actually runs the room once the meeting starts. This live “room reading” is the core of a dynamic communication plan. It lets you adjust your flow on the fly and ensure every voice is heard.

These tactics give your group time to process information. They are like effective teams sorting and re-sorting cards to think through complex issues. Let’s explore three powerful techniques.

Cold-Open Questions: Bypass the Small Talk

Start with a question that cuts straight to the heart of the matter. A cold-open question immediately taps into the group’s primary concern or hope.

For example, ask a player, “What’s the one word that describes your goal for this season?” Ask a parent, “What is your biggest hope for your athlete’s experience this year?” This tactic bypasses awkward introductions. It gathers critical emotional data from the very first minute.

You instantly see who is eager, who is hesitant, and what themes are bubbling under the surface. It sets a tone of direct, meaningful dialogue.

Show-of-Hands: Create Visual Consensus

This low-tech method has high impact. Frame a question that requires a simple raised hand. It creates a powerful visual of group opinion.

You might ask, “How many feel our communication last season was timely and clear?” Or, “Show of hands if you’ve reviewed the new safety protocol document.”

This technique is excellent for revealing divides or confirming alignment. It makes abstract opinions concrete. A room half-raised tells a different story than a room fully raised. It encourages participation from those less likely to speak up first.

QR Code-Linked Live Polls: Capture Honest Feedback

For anonymous and inclusive input, use a live digital poll. Participants scan a QR code to answer questions in real-time on their phones.

This is perfect for sensitive topics or gauging true sentiment. You could poll stakeholders on budget priorities or ask players to rate their understanding of a new rule anonymously.

Integrating this tool into your communication plan ensures you capture honest opinions from quieter personas. It democratizes the conversation. The instant results allow you to address concerns immediately, much like the dynamic adjustments noted in research on inclusive facilitation.

Together, these room read tactics transform a one-way presentation into a responsive dialogue. They are not just activities. They are essential sensors for your live communication plan. Use them to listen, adapt, and lead your mixed audience toward a shared goal.

Accessibility: captions, contrast, jargon busters, multilingual handouts

True audience-first communication builds bridges, not barriers. This starts with making things accessible. These steps are not just for checking boxes. They are key strategies that help you reach more people and help them understand better.

Inclusive practices show respect and value diverse views. This supports the “Appreciation for Diversity” principle. It turns your audience analysis into real action.

A diverse group of professionals engaged in an inclusive meeting setting, showcasing accessibility features in presentation handouts. In the foreground, a well-organized table with colorful, clearly labeled handouts displaying large captions and multilingual options. The middle area includes a projector screen displaying accessible visuals with high contrast imagery. In the background, a bright, modern meeting room filled with natural light, large windows, and greenery, evoking a welcoming atmosphere. Professionals of various backgrounds are wearing smart business attire, focusing intently on the materials. The scene captures a sense of collaboration and empowerment, emphasizing the importance of accessibility in communication. Soft, even lighting enhances the details without harsh shadows, creating an inviting environment.

Don’t Mute the Message: The Power of Live Captions

Live captions are key for virtual meetings and videos. They meet ADA rules but do more.

Captions help in loud places, like a busy home. They help those who learn better by reading. They also help those who speak English as a second language.

Using a good auto-caption service or a professional captioner makes sure your main points are clear. This includes team philosophy or season schedules.

Design for the Eyes: High-Contrast Visuals

Readability is key. Slides with low contrast, like gray text on a light background, hurt eyes and lose focus.

Choose high-contrast colors. Dark text on white or bright white on deep blue makes data clear. This is true for fundraising goals or performance metrics.

Apply this to handouts and digital documents too. A clean, high-contrast design is professional and easy to read.

Speak Everyone’s Language: Busting Jargon

Every field has its own jargon. “NTDP” or “load management” might be familiar to an athletic director board member. But to a new parent at a parent meeting, it’s confusing.

Jargon busters help bridge this gap. A simple glossary in your pre-meeting packet helps. Explain key terms when you first use them.

Say, “For those new to our program, ‘ELO rating’ is a system we use to…” This makes complex ideas easy to understand. It welcomes newcomers.

Welcome Every Family: Multilingual Handouts

Multilingual materials show respect to families where English is not the main language. They make sure your communication plan reaches everyone.

Providing key handouts in multiple languages shows you care. It helps non-native speakers follow along and engage fully.

This practice meets the needs of your personas. It builds a more supportive and united community around your program.

Accessibility Tool Primary Purpose Key Action Benefits Key Persona
Live Captions Ensure auditory information is accessible visually. Enable auto-captions on your video platform. Parents in noisy homes, visual processors.
High-Contrast Design Maximize readability and reduce eye strain. Use dark text on light backgrounds for all slides. All attendees, including those with visual impairments.
Jargon Busters Demystify insider terminology for clarity. Create a one-page glossary for complex terms. New parents, sponsors new to the sport.
Multilingual Handouts Provide equal access to critical information. Translate core documents into top 2-3 languages in your community. Families with English as a second language.

Using these tools is the practical result of a detailed audience analysis. By removing barriers, your message reaches and engages everyone. It moves everyone toward your shared goal.

Templates: 3 Variants of the Same Slide (Player/Parent/Stakeholder)

Creating three different visual templates for one message is key to effective communication. It’s like a card game where everyone works together but uses their own cards. Each card is designed to be clear and relevant to the player.

This approach makes sure your message is understood by teachers or outside stakeholders. The goal is the same, but the way it’s presented is tailored. Let’s create something you can use right away.

We’ll make three versions for a single important message: starting an Off-Season Training Program. A main slide deck has all the content. You can quickly make the right version for your audience without starting over, supported by communication strategy principles on tailoring messages for different stakeholders from audience segmentation.

Player Variant Slide

This slide talks to the athlete’s goals and everyday life. It aims to have a strong impact and personal benefits.

  • Imagery: Pictures of athletes training, not logos or text-heavy charts.
  • Core Message: “Get stronger, gain an edge, and own your next season.”
  • Key Details: A clear, simple weekly schedule and locations.
  • Call-to-Action: A clear link for sign-up.

The language is motivational and to the point. It answers the player’s main question: “What’s in it for me, and how do I start?”

Parent Variant Slide

This version is for a parent meeting. It covers logistics, costs, and safety. It aims to build trust and ease worries.

  • Imagery: Photos of certified coaches, safe places, and friends.
  • Core Message: “A safe, structured, and valuable investment in your athlete’s growth.”
  • Key Details: Show coach certifications, a clear cost/value breakdown, and how to get there.
  • Call-to-Action: A QR code for more info.

This slide gets ahead of questions. It shows the program as a wise choice.

Stakeholder Variant Slide

This slide is for the athletic director board, sponsors, and school leaders. It looks at the program’s benefits for the school.

  • Imagery: Clean infographics and data.
  • Core Message: “Improving athlete safety, keeping them, and boosting program reputation.”
  • Key Details: Show injury rate drops and better retention. Align with school goals.
  • Call-to-Action: Sponsorship and partnership options.

The tone is professional and based on facts. It shows how the program helps the school’s goals.

Having a master content deck is a big advantage. You never start from scratch again. You just use approved content for your slides. This keeps your message consistent and saves a lot of time.

Your messages become scalable, professional, and precise. You meet every audience exactly where they are.

Follow‑up cadences and feedback forms

The game may end, but your communication doesn’t. A smart follow-up turns a single presentation into a lasting conversation. Success relies on a clear plan that outlines who gets what and when.

Stakeholders have different needs. Send a personalized thank-you within 24 hours, mentioning a specific comment. Athletic directors and sponsors get a detailed summary with next steps in 48 hours. Players, on the other hand, prefer a motivational update on a team app.

Announcing your timeline for reporting back builds trust. It shows you value their input.

Effective feedback forms are key. Don’t just ask if they were satisfied. Ask specific questions like “What should we start doing?” or “What’s unclear?” Make sure your forms work well on phones, as 96% of people use them during events.

This approach is a core part of proven strategies for engaging sports stakeholders.

The data you collect drives improvement. Feedback is the main source for analyzing your next audience. Use it to refine messages, adjust follow-ups, and track ROI through dashboards or scores.

This cycle of listening, acting, and reporting back strengthens every relationship. It solidifies your long-term communication plan.

10 Core Skills for High-Impact Sports Presentations

The sports world is growing fast. Coaches, athletic directors, and business pros need to mix passion with strategy. Being able to share vision, data, and inspiration clearly is key to success.

Research in sports psychology, like Jack Lesyk’s, shows what makes athletes great. Skills like staying focused, setting goals, and handling anxiety are essential. These skills are also vital for professional communication. When you speak in front of people, you’re under pressure.

Being great at presentations is not just talent. It’s a skill you can learn and get better at. It involves planning, being mentally ready, and executing well.

This article is your guide. It turns proven performance ideas into a simple plan for anyone who needs to share, convince, or lead. You’ll learn to organize your message, grab your audience’s attention, and show authority anywhere.

Core Skills Playbook

High-impact presentations in sports don’t happen by chance. They are built on a pyramid of practiced mental and communication skills. This collection of ten core abilities forms your essential playbook. Think of it as your strategic guide for every talk, meeting, or pitch.

Just like an athlete’s performance pyramid, these skills are layered. Foundational mental skills support everything else. Sports psychology teaches us that Level I skills include maintaining a positive attitude, self-motivation, and setting high, realistic goals. These are the bedrock. For a presenter, this translates to the inner game of confidence and clear intention.

The next levels involve preparation and in-the-moment execution. Strong communication and leadership are essential here. They demand clarity in articulating goals and empathy in managing team dynamics. This holistic view means your storytelling power and your audience alignment are not soft skills. They are trained competencies.

Mastering this playbook is about committed learning, not innate talent. Every skill can be broken down, practiced, and improved. The following sections will group these ten skills into actionable sets. We start with the strategic foundation: planning your message and connecting with your listeners.

To visualize how these skills interconnect, consider the framework below. It maps the psychological foundation to the practical presentation skills you will develop.

Performance Pyramid Level Core Mental Focus Presentation Skill Category
Level I: Foundation Positive attitude, self-motivation, realistic goal-setting Strategic Clarity (Skills 1-3)
Level II: Preparation Focused planning, stress management, visualization Content & Design (Skills 4-6)
Level III: Execution Confidence, adaptability, focus under pressure Delivery & Facilitation (Skills 7-10)

This structured approach ensures your development is balanced. You cannot have powerful storytelling without first knowing your objective. You cannot achieve genuine audience alignment without understanding their needs. Each layer supports the next.

Effective communication is the engine of strong team culture. It demands the same level of discipline as any high-performance skill. By treating your presentation abilities as a learnable system—much like mastering the latest CAD design tools—you shift from simply hoping your talk succeeds to intentionally engineering a presentation that delivers results. That mindset is what separates beginners from confident communicators.

Skill 1–3: Message clarity, objective setting, audience alignment

Just like an athlete needs a game plan, a presenter must have a solid strategy. The first three skills are like preseason training. They happen before you start designing your slide design. This is the foundation of your presentation skills.

Message Clarity is your main idea. It’s what you want your audience to remember. Simplify your complex topic into one clear sentence. If it’s hard to say simply, it’s not clear enough.

A visually captivating slide design illustrating the concept of storytelling in sports presentations. In the foreground, a sleek, modern computer screen displays vibrant, engaging slides filled with diagrams and bullet points related to clarity, objectives, and audience alignment. In the middle ground, a diverse group of professionals, dressed in sharp business attire, are animatedly discussing the content, showcasing expressions of focus and enthusiasm. The background features a bright, airy conference room with large windows letting in natural light, enhancing the motivational atmosphere. The overall mood is energetic and professional, with a balanced composition using a slightly elevated angle to capture depth and interaction.

Objective Setting makes your message a goal. Use the SMART framework for clarity. Ask yourself, “What do I want my audience to do or understand by the end?” A clear goal helps focus and effort, like a training target for an athlete.

Your goal could be to get approval, teach a new skill, or inspire a change. Having a precise goal gives your presentation direction.

Audience Alignment is like knowing your opponents. Who are they? What do they already know? What do they need and expect? This analysis is key to understanding your role in the meeting or event.

Make your content, examples, and language fit your audience. This makes your message more engaging and relevant. It turns a generic talk into a meaningful conversation.

These three skills ensure your presentation is impactful. They are the first steps to a successful performance. Only after planning should you think about storytelling and slide design.

Skill 4–6: Storytelling (SCQA/PREP), Visual Hierarchy, Data Literacy for Coaches

Think of these skills as your presentation’s production team. They turn a good script into an unforgettable show. They make your strategy into an engaging, visual story that grabs attention and drives decisions.

Skill 4: Master Storytelling Frameworks (SCQA/PREP)

Facts tell, but stories sell. A structured narrative is your most powerful tool for making information memorable. Two proven frameworks can help you build that narrative.

The SCQA method (Situation, Complication, Question, Answer) mirrors how we naturally solve problems. You start by describing the current state, introduce a challenge or conflict, pose the critical question, and deliver your solution. It creates a logical, persuasive flow.

The PREP framework (Point, Reason, Example, Point) is ideal for making a single argument crystal clear. State your main point upfront, give the reasoning, provide a concrete example, and then restate the point to reinforce it.

Just as elite athletes use detailed mental imagery to rehearse success, these frameworks allow you to pre-visualize your entire presentation arc. They ensure your audience follows and feels every step of the journey.

Your slides are a visual aid, not a script. Effective slide design guides the audience’s eye and emphasizes what matters most. It supports your spoken words without repeating them verbatim.

Key principles create this hierarchy. Use size, contrast, and placement to signal importance. A large, bold headline anchors the slide’s topic. Supporting points should be smaller. Ample white space prevents clutter and lets key elements breathe.

Every visual element must have a purpose. Is that chart clarifying a trend? Is that icon making a concept instantly recognizable? If an element doesn’t serve your core message, remove it. A clean, focused slide amplifies your authority and keeps the audience locked on you.

Skill 6: Develop Data Literacy for Coaches & Executives

The sports industry runs on data, from player performance metrics to fan engagement statistics. Data literacy is the skill of translating these complex numbers into clear, compelling stories that leaders can act upon.

This goes beyond just showing a spreadsheet. It means asking, “What does this data mean for our strategy?” and then visualizing the answer. Turn a table of financials into a simple graph highlighting growth or a key risk. Transform player stats into an infographic that shows strengths and gaps at a glance.

This shift towards data-driven decision-making requires digital fluency. Coaches and business leaders need insights, not raw data. Your job is to be the interpreter who provides those insights visually, enabling faster, more confident decisions in the boardroom or on the sidelines.

Together, storytelling, visual design, and data translation are the assembly skills. They take your planned message and give it a powerful, persuasive form that resonates long after the presentation ends.

Skill 7–10: Facilitation and Q&A, presence/voice, timeboxing, tech readiness/checklist

Getting from planning to speaking is all about four key skills. These skills turn your hard work into a standout performance. They make the difference between a good and great talk.

Think of this phase like an athlete on game day. It needs quick thinking, emotional control, and sharp focus.

Great talks are like conversations, not lectures. Facilitation is about leading that conversation. It’s about reading the room and connecting with your audience.

Start with a thought-provoking question. Use polls or quick hand raises to get everyone involved. This builds a connection right away.

The Q&A session can be scary. But, see tough questions as chances to shine. Use the “Listen, Validate, Respond” method. First, listen fully without interrupting. Then, show you get their point. Lastly, give a clear, concise answer.

This approach is like how top athletes handle pressure. It’s about staying focused and calm.

Skill 8: Commanding Presence and Body Language

Your body speaks before you do. Confident body language shows authority and trust. Stand wide, with an open posture.

Make eye contact with people across the room. Hold someone’s gaze for a full thought before moving on.

Your voice is powerful. Use it to highlight important points. Speak slower for key ideas and louder when you’re passionate. A flat voice will lose your audience, no matter the content.

This skill is your competitive edge. It’s the focused energy a coach has during a timeout.

Skill 9: Disciplined Timeboxing

Respecting your audience’s time is key. Timeboxing means rehearsing to fit your content perfectly. It’s about editing ruthlessly and pacing well.

Divide your talk into timed parts. For example, a 20-minute talk might have a 3-minute intro, 12-minute main content, and a 5-minute wrap-up with Q&A. Practice with a timer until you hit these marks every time.

This discipline is like a pre-game routine. It reduces stress by creating a predictable flow. You know what’s next, freeing your mind to focus on your delivery.

Skill 10: Flawless Tech Readiness

Technical issues can ruin a presentation. A checklist prevents this. Always run through it before you speak.

  • AV Equipment: Test the projector, microphone, and clicker. Have backup batteries.
  • File Backups: Save your presentation on the cloud, a USB drive, and email it to yourself.
  • Room Setup: Check sightlines from the back. Ensure the screen is visible to all.
  • Contingency Plan: Know what you’ll do if tech fails. Can you present without slides?

This checklist is your pre-game prep. It makes sure you’re ready for anything. It solves problems before they happen.

These four skills ensure you deliver with impact. They handle the live challenges that separate prep from performance. Master them, and you’ll present with confidence.

Drills: rehearse with 5‑minute lightning talk; record/feedback loop

Knowing what to do and doing it well are two different things. Coaches don’t naturally have presentation skills. They get better with practice, just like athletes do.

This idea is called “train it–trust it.” You practice a skill when it’s easy, so you can do it well when it matters most. This idea helps with your communication training.

The 5-Minute Lightning Talk Drill

This drill helps you be clear and to the point. You need to explain a key idea in just five minutes.

Use a timer to keep yourself on track. Start with a clear introduction, then share three main points, and end strong. This drill removes unnecessary words and shows your skill in simplifying complex ideas.

It’s a test of how well you can make your point quickly. Can you get your message across before time runs out?

A dynamic scene showcasing a coach leading a presentation skills drill practice in a spacious, modern training facility. In the foreground, a diverse group of athletes dressed in professional business attire gathers around a presenter at a podium, who is engagingly demonstrating techniques for effective lightning talks. The middle ground features various attendees recording feedback on tablets and notepads, emphasizing the iterative learning process. Bright, natural light floods through large windows, casting soft shadows and creating a motivating atmosphere. The background includes motivational posters related to communication skills. The camera angle offers a slightly elevated perspective, capturing the excitement and focus of the participants as they engage in this essential skill-building exercise.

Being aware of yourself is key. Record your lightning talk or any presentation. Then, watch it and focus on specific areas.

Use a checklist to evaluate yourself. Are your visuals clear? Is your story engaging? How’s your voice?

Get feedback from someone you trust. Ask them to focus on one or two areas. This cycle of practice, review, and improvement helps you get better fast.

Supporting Mental Techniques

Use mental exercises, like top athletes do, along with these drills.

  • Visualization: Imagine yourself doing well in your presentation.
  • Reframing: See nervousness as excitement to perform.
  • Controlled Breathing: Deep breaths help calm you down before you start.

The table below shows how to mix these drills into your routine.

Drill Primary Purpose Core Process Key Benefit for Coaches
5-Minute Lightning Talk Develop clarity and conciseness under pressure. Choose one topic. Structure a talk with a clear beginning, middle, and end. Deliver it within a strict 5-minute timebox. Builds confidence in delivering crisp, impactful messages in time-constrained environments like timeouts or halftime.
Record/Feedback Loop Increase self-awareness and target specific skill gaps. Record a practice session. Review it personally, then with a peer, focusing feedback on 1-2 skills from the playbook. Creates objective data on performance, moving improvement from subjective feeling to measurable progress.
Combined Practice Translate theory into reliable muscle memory. Perform a Lightning Talk, record it, and use the recording for your Feedback Loop analysis. Embodies the “train it–trust it” philosophy, making advanced presentation skills for coaches automatic and dependable.

Practice these drills regularly, like any sport skill. Doing so turns knowledge into real, effective skills. Your presentations will become more confident, engaging, and effective in leading your team.

Rubric: novice → proficient → expert descriptors

Just like a coach reviews game film, a presenter needs a rubric to check their skills. Sports psychologists start by checking an athlete’s skill level and then check again to see how much they’ve improved. This is also true for improving your communication skills.

A clear rubric is like your personal game film. It helps you see where you stand and guides you on how to get better. By checking yourself against the 10 core skills, you move from feeling unsure to tracking your progress clearly.

Let’s look at facilitation as an example. Being able to lead the audience and handle questions is key. Here’s how this skill changes at different levels.

For the skill of Facilitation:

  • Novice: Often tries to avoid or control questions. Answers might be short, defensive, or off-topic. The presenter sees Q&A as a problem, not a chance to engage.
  • Proficient: Comfortably answers questions and starts discussions. Keeps answers relevant and on track. Uses methods like repeating questions to make sure everyone understands. Works on better ways to connect with people.
  • Expert: An expert in facilitation smoothly handles Q&A to deepen understanding and build agreement. They think ahead, steer the conversation to key points, and handle different opinions well. The session feels like a team effort.

Use this three-column framework for all ten skills. Set a time every quarter to review your progress. This regular check-in, like using the MTQ48 to measure mental toughness, shows your growth clearly.

This rubric lets you take charge of your growth journey. It turns the vague goal of “getting better” into clear steps. By mastering facilitation and other key skills, you deliver presentations that not only teach but also motivate people to act.

Resources and practice calendar

Mastering ten core skills turns knowledge into habit. The key is consistent, deliberate practice. We offer a downloadable 90-Day Practice Calendar to help you.

This calendar schedules drills like weekly lightning talks and feedback sessions. It builds your confidence step-by-step.

Expand your learning with key resources. Check out books on sports psychology by Jim Afremow and classics on business communication. Also, consider attending industry conferences and joining professional organizations like AISTS.

These forums are great for staying updated on digitalization and data analytics trends.

Effective presentation facilitation starts with solid preparation. For a proven framework, review this structured preparation guide. Use it with our calendar for a complete system.

Your growth goes beyond the podium. Each skill practiced strengthens your leadership and impact in all professional conversations. Start your 90-day practice today.

Why Effective Presentations Matter in Sports Coaching and Management

Winning on the field starts long before the first whistle. It begins in the meeting room. Here, a leader’s clear and compelling message can make or break a season. For coaches and sports executives, making a great game plan is just the start. The real challenge is getting that strategy into every athlete’s and staff member’s heart and mind.

Data shows a stark truth. Research from European Leaders found that 68% of employees don’t understand their company’s vision. This leads to disengagement. On the other hand, 41% of people say clear communication in coaching and leadership boosts performance. In sports, poor communication can lead to athlete burnout, causing stress and a lack of control.

This isn’t about flashy slides. It’s about aligning strategy, building culture, and developing athletes. Mastering this art is as important as designing the playbook. For a modern guide on this process, check out these seven steps for a successful team. Your ability to present effectively decides if your team just hears the plan or truly owns it.

Introduction: From whiteboard to widescreen—why delivery shapes outcomes

Switching from chalk talks to digital storytelling is more than just a tech upgrade. It’s a big change in how leaders communicate. The old whiteboard was good, but today’s world needs more.

Now, coaches and managers work on a digital stage where every detail matters. Every team meeting, parent night, or sponsor pitch is like a show. Sociologist Erving Goffman called this a “frontstage” performance. Here, leaders show their identity and manage how they are seen.

The coach is like the narrator, telling the team’s story. How well they do this affects how the message is received.

Being clear, engaging, and professional in your delivery is key. It’s what gets buy-in, trust, and execution. A poor delivery can undermine confidence. But a strong one can inspire commitment. Your delivery makes the difference.

To grasp this change, look at the old ways versus the new ones.

Aspect The Whiteboard Era The Widescreen Era
Primary Medium Static, physical board Dynamic, digital screen
Audience Reach Immediate room only Local & remote (video, clips)
Engagement Style One-way instruction Interactive, multimedia experience
Narrative Control Limited to the moment Consistent, repeatable story
Impression Management Informal, behind closed doors Professional, public-facing performance

The table shows a complete change. The widescreen approach gives you tools for a more powerful performance. It lets you create a story that sticks with people long after the meeting.

Effective presentation delivery is a key skill for leaders today. It’s how you turn strategy into understanding and motivation into action. The next sections will cover the benefits, the science behind good communication, and practical tools to improve this skill.

Benefits for teams: clarity, faster decisions, consistent language, motivation, compliance/safety

Effective presentations do more than show play diagrams. They change how teams work and perform. It’s not about fancy graphics for coaches and managers. It’s about making sure everyone understands and works together.

Research shows clear talk leads to better performance and teamwork. A good presentation brings many benefits.

Clarity Eliminates Confusion. A clear presentation removes confusion. It explains roles and expectations clearly. This clarity is key to better meeting effectiveness.

When athletes know what to do, they perform better. This is the first step to success.

Faster Decisions Emerge from a Shared Mental Model. When everyone sees and hears the same, they work better together. This means teams can make quicker decisions. They understand the “why” behind each play.

Consistent Language Reinforces Learning. Using the same words helps everyone learn faster. It makes complex ideas clear. This makes players understand better and work less hard to remember.

Motivation is Fueled by Connection. A good presentation motivates by showing how daily work fits into a bigger goal. This connection is key for player buy-in. Players who see the purpose of their effort are more dedicated and productive.

Compliance and Safety Depend on Crystal-Clear Briefings. Clear presentations are vital for following rules and staying safe. They make sure everyone knows what to do. This keeps everyone safe and reduces stress.

Good communication improves well-being and teamwork. It makes teams smarter and more united. This leads to better decisions and a stronger team.

Investing in presentation skills improves meeting effectiveness and player buy-in. It creates a team that works together confidently and with purpose.

Cognitive science basics: working memory, dual-coding, spacing; what that means for slides and clips

By using a few key principles from cognitive psychology, you can make your slides and clips unforgettable. It’s not about complex theories. It’s about simple rules that help your message stick in an athlete’s mind.

Great coaches are also great teachers. They know how learning works. Let’s break down the science into steps you can use for your next team meeting or training session.

A dynamic sports coaching presentation scene, focusing on cognitive science principles, prominently featuring an engaged coach in professional business attire presenting to a diverse group of attentive trainees. In the foreground, the coach gestures toward a projection screen displaying visually appealing dual-coding materials—images and infographics illustrating working memory, dual-coding theory, and the spacing effect. In the middle ground, trainees of different ethnicities sit at a round table with notebooks and laptops, taking notes. The background showcases an inspiring and modern training facility with large windows allowing natural light to pour in, creating a bright and focused atmosphere. Use a slight high-angle perspective to capture the interaction and engagement, evoking a mood of motivation and learning.

Think of working memory as the brain’s whiteboard. It holds new information for a short time before it’s either forgotten or saved into long-term memory. A key fact is that it can only handle about four “chunks” of information at once.

Text-heavy slides overwhelm this system. When athletes are busy reading paragraphs, they stop listening to you. This leads to cognitive overload and poor retention.

The coaching rule is simple: Use slides for visuals, not for scripts. Bullet points should be short. Complex ideas need diagrams, not dense text. This reduces mental strain and keeps focus on your voice.

Power Up with Dual-Coding Theory

This principle states that information is remembered best when it’s presented through two channels: verbal and visual. Words are processed in one part of the brain. Images and sounds are processed in another.

When you pair them, you create two mental “codes” for the same idea. This doubles the chance of recall. A play diagram with a narrated video clip is far more powerful than a description alone.

Your presentations should show and tell. Use concise verbal explanations alongside relevant video clips, icons, or infographics. This strategy is key for any coach looking to enhance team communication and ensure complex strategies are understood.

Leverage the Spacing Effect

Cramming doesn’t work for tests, and it doesn’t work for coaching. The spacing effect proves that we learn better when exposure to information is spread out over time.

One marathon film session is less effective than three shorter, focused meetings. Revisiting core concepts—like a defensive scheme or a rehab protocol—across multiple sessions strengthens memory pathways.

Plan your messaging calendar. Introduce a concept, then reinforce it in the next meeting with a quick recap. This spaced repetition builds durable knowledge, moving skills from conscious practice to automatic execution.

Connecting to the “Possible Selves” Theory

Cognitive science also involves identity. The “Possible Selves” theory relates to how people imagine their future selves—like an athlete visualizing themselves as a champion or a leader.

Your presentations directly shape this “working self-concept.” Consistently showing clips of perfect form, highlighting team values, or visualizing success reinforces the identity you want athletes to adopt.

Every slide and video is a mirror showing them who they can become. By spacing out these identity cues, you help mold their future-oriented mindset, aligning their self-concept with team goals.

Cognitive Principle What It Means Coaching Application Slide & Clip Tip
Working Memory Limits The brain’s short-term holder has very limited capacity. Avoid overloading players with too much new info at once. Use 1-2 key visuals per slide; never full sentences.
Dual-Coding Theory Combining words with images creates stronger memory traces. Always pair your verbal instruction with a relevant visual. For a new play, show a diagram while narrating the player movements.
Spacing Effect Learning improves with repeated, spaced-out exposure. Break a complex system into parts taught over several days. Start each session with a 90-second recap clip from the last meeting.
Possible Selves People are motivated by visions of their future identity. Use media to consistently show the behaviors of a “champion.” Include short clips of elite execution as aspirational benchmarks.

These aren’t abstract ideas. They are levers you can pull today. Design your next presentation with the brain in mind. Limit text, pair words with powerful visuals, space out your key messages, and tap into your team’s vision for their future.

When you align your methods with how the mind actually learns, you stop hoping your message gets through. You start knowing it will.

Use cases: pre-season vision, play installs, rehab plans, parent meetings, sponsor decks

Coaches play a big role in sports, beyond just drawing plays. They inspire athletes, teach parents, and win over sponsors. Each task needs a special way to communicate.

Coaches talk to many people: players, staff, media, fans, and parents. A single presentation won’t work for everyone. Smart coaches adjust their style to fit each group’s needs.

Pre-Season Vision Meetings set the tone for the year. They aim to inspire and share a big vision. Use images, videos, and clear values to unite the team.

Play Installs and Strategy Sessions focus on details. They use visual aids like XOS or Hudl to teach. Seeing the play drawn and then executed helps players understand better.

Rehab Plan Presentations need empathy and teamwork. Show progress with graphs and timelines. Frame the plan as a journey back to competition, not just restrictions.

Parent and Guardian Meetings require honesty and reassurance. Explain the team’s philosophy, safety, and expectations clearly. Use FAQs and highlight support systems to build trust.

Sponsor and Partnership Decks are professional and focused on results. Show data and opportunities for growth. Align the team’s values with the partner’s mission for mutual benefit.

Use Case Primary Audience Core Goal Key Presentation Tactic
Pre-Season Vision Athletes & Coaching Staff Inspire and unify around a common identity Big-picture storytelling with motivational media
Play Installs Athletes & Coordinators Precise technical knowledge transfer Dual-coding with animated diagrams and game film
Rehab Plans Injured Athlete & Medical Staff Build trust and motivate through recovery Visual progress trackers and collaborative roadmaps
Parent Meetings Parents & Guardians Transparent communication and expectation setting Jargon-free FAQ format and clear protocols
Sponsor Decks Corporate Partners & Executives Align brand values and demonstrate ROI Professional decks focused on metrics and shared mission

The table shows the need for flexibility. Coaches must motivate, teach, counsel, negotiate, and sell. Mastering these skills makes a coach great. By adjusting your approach, your message will be clear and acted upon.

ROI metrics: retention quizzes, adoption rates, error reduction, attendance, survey NPS

Sports leaders now measure presentation success with clear numbers. This approach turns meetings into tools for growth. It shows how well your message is getting through.

Good communication boosts team performance and engagement. You need proof to show your value. By tracking ROI metrics, you can prove your worth and improve your strategy.

A visually engaging representation of ROI metrics for sports presentations, featuring a modern conference room scene. In the foreground, a large digital screen displays colorful graphs and charts related to retention quizzes, adoption rates, error reduction, attendance, and survey NPS. In the middle, a diverse group of professional individuals in business attire are gathered around a sleek conference table, discussing the metrics with expressions of insight and collaboration. The background showcases a stylish interior with large windows letting in natural light, emphasizing an inspirational atmosphere. The lighting is bright and focused on the screen while the table has a subtle reflection of the charts. The angle is slightly elevated, providing a comprehensive view of the dynamic interaction among the participants and the digital display.

Focus on five key metrics to see how your meetings impact your team. Each metric offers a unique view of your message’s success, similar to how community economic development events measure engagement and outcomes across different stakeholders.

Retention Quizzes quickly check if your message stuck. A short quiz right after or 24 hours later shows what players remember. High scores mean you’re clear; low scores mean you need to explain better.

Adoption Rates show if your teaching works. Watch how quickly players use new techniques. A high adoption rate means your teaching is effective.

Tracking Error Reduction shows your impact on the field. Did your special teams meeting cut down penalties? Did your film session improve defense? By focusing on errors, you see your communication’s direct impact.

Attendance and engagement show team sentiment. If players show up and participate, they value your information. Falling attendance means it’s time to change your approach.

A Survey NPS question measures team happiness. Ask: “How likely are you to recommend this meeting?” and “Why?” This shows the emotional impact of your style.

The table below compares these metrics. It shows how to measure them and what insights they provide.

ROI Metric How to Measure It Key Insight Provided
Retention Quizzes Short, graded quiz post-meeting; track average scores over time. Immediate understanding and recall of critical information.
Adoption Rates Direct observation in practice; track % of players correctly executing the new technique. Translation of knowledge into consistent action and behavior change.
Error Reduction Review game/practice film for specific errors discussed; track frequency before and after the presentation. Direct impact of communication on technical and tactical performance.
Attendance & Engagement Track sign-in sheets for voluntary sessions; note participation levels and questions asked. Perceived value and motivational pull of your communication.
Survey NPS Anonymous digital survey post-key meeting; calculate the Net Promoter Score (Promoters % – Detractors %). Overall sentiment and likelihood of advocacy for your methods.

By tracking these metrics, you make your presentation success clear. You build a strong case for your leadership. Most importantly, you get the evidence to keep improving your communication. This ensures every meeting and session moves your team closer to its goals.

Common pitfalls: text-heavy slides, overlong meetings, unclear next steps

Let’s look at the three main mistakes that ruin a meeting. These mistakes hurt meeting effectiveness by ignoring how we learn and focus. By knowing these traps, you can make your meetings clear and effective.

Text-heavy slides, long meetings, and unclear next steps are the main culprits. These mistakes don’t just bore your team. They also lead to poor listening and low engagement.

Slides full of text make it hard for your team to listen and read at the same time. This breaks the rule that we learn best through both visuals and narration. When slides are just text, people get distracted and miss the message.

The Marathon Meeting Problem

Human attention has limits. Meetings longer than 45-60 minutes without breaks are bad for learning. In long meetings, people lose focus and start to mentally check out.

The Ambiguous Finish Line

A meeting without clear next steps is a waste. It leaves everyone confused about what to do next. This confusion makes the meeting feel pointless.

The table below shows these pitfalls, their effects, and how to fix them based on science.

Common Pitfall Impact on Team & Engagement The Science-Based Fix
Text-Heavy Slides Causes cognitive overload and distraction. Listeners stop processing your spoken words. Use the 6×6 rule: max 6 words per bullet, 6 bullets per slide. Rely on diagrams, icons, and short video clips.
Overlong Meetings Violates attention span and spacing effect. Leads to mental fatigue and poor retention. Cap core agenda items at 45 minutes. Use a hard stop. For longer sessions, schedule a 10-minute break every hour.
Unclear Next Steps Creates confusion and inaction. Team members leave unsure of their role, providing no feedback. Dedicate the final 5 minutes to reviewing action items: Who? Does What? By When? Send a one-line summary email immediately after.

Avoiding these three mistakes can greatly improve your meetings. It changes your focus from just sharing information to creating an engaging experience. This leads to less stress, better alignment, and real progress.

Quick toolkit: slide templates, clip libraries, diagramming apps

Get these essential tools to make your coaching presentations stand out. They help avoid common mistakes by making visuals easy to understand. This toolkit offers simple, yet powerful tools for coaches.

Slide Templates keep your slides looking good and consistent. Canva and PowerPoint have sports-themed templates to save time. They help coaches make professional slides without needing design skills.

Using templates has many benefits:

  • It keeps your team’s look consistent
  • It saves time for meetings and presentations
  • It guides the audience’s attention
  • It works well on all devices

Clip Libraries make teaching footage easy to find. Hudl and cloud storage with tags help. Even a simple folder system can be very useful.

Organize your clips by:

  1. Skill categories (blocking, passing, defense)
  2. Player groups (varsity, junior varsity, specific positions)
  3. Situations (game footage, practice drills)
  4. Teaching points (what to do, what to avoid)

Diagramming Apps make play plans clear for athletes. Tools like TacticalPad and PlaybookX are easy to use. They are better than whiteboard sketches.

Good diagrams help athletes understand by combining visuals and words. Coaches can add notes and export diagrams for slides. This method helps learn in different ways.

Using these tools helps create a system for teaching and feedback. They make multimedia coaching easier, not harder. Start with one tool and learn it well before adding more.

Remember, tools help your teaching, not replace it. The best multimedia coaching mixes good tools with your skills. This way, coaches can share complex ideas clearly and effectively.

Action plan: 30-day upgrade checklist + sample agenda

Changing how you present doesn’t take a long time. A 30-day plan can help you build new habits. Start by realizing you need to change, just like top programs do.

Week 1: Audit. Look over your slides and film sessions. Is your whiteboard clear or messy? Find specific things to change, like fewer text-heavy slides.

Week 2: Implement one tool. Pick one new method to use. This could be a diagramming app for play design or using biometric visuals like Alabama’s eye-tracking film review.

Week 3: Practice in a low-stakes meeting. Try out a short session using the 70/30 rule. Present 70% familiar stuff and 30% new. Show how to make quick decisions like in a game.

Week 4: Measure and adapt. Ask your team for feedback. Check simple things like quiz scores or fewer mistakes. Use this feedback every day.

Your 45-minute team meeting should follow this plan. Start with a clear goal. Use clear visuals and explain them briefly. Add an interactive “what if” scenario. End with 2-3 steps to take next. This method helps your team grow and perform better, as shown in this guide.

Animations and Visual Effects: Make Sports Data Come Alive

Let’s be honest – staring at static spreadsheets of sports data is boring. Why not turn numbers into a digital dance?

The NHL knows this. They use Sony’s Beyond Sports technology to make data come alive. Their HOCKEYVERSE programs turn data into stories.

It’s not just about looks. Animation creates a connection that static charts can’t. It makes data stories that everyone can enjoy.

When data is animated, it becomes a story. Every pass and save is a part of the drama. This tech opens up new ways to make numbers exciting.

Pythagoras would be amazed. We’re not just showing numbers. We’re creating visual stories that feel like movies.

Tools for Creating Animated Slides

Remember when making sports animations was hard with PowerPoint? It felt like pushing a boulder up a hill. But now, that’s all changed.

Today, we have tools that are much better. They’re not just simple apps anymore. They’re powerful platforms that make creating motion graphics easy, even for those who aren’t designers.

These tools are amazing because they use real data. They turn game stats into cool animations. It’s like having a top-notch animation studio in your laptop, and it’s affordable.

Tactic3D is leading this change with its software. It makes 3D animated playbooks for all devices. And it’s priced for everyone, from hobbyists to big teams.

Platform Starting Price Key Feature Ideal For
Windows/Mac $40/month Full 3D rendering Team analysts
iOS/Android Free basic tier Touch interface Field coaching
VR Headsets Enterprise pricing Immersive training Professional teams

Modern motion graphics tools are great because they’re easy to use. They have simple interfaces and can use real-time data. This means your animations are always up-to-date.

Tactic3D and others have made sports animation easy for everyone. What used to take days now takes just minutes. The tools have really improved.

Best Effects for Sports Data

The difference between forgettable data and memorable insights often comes down to visual impact. I’ve seen many animated slides. Some score touchdowns, while others fumble at the goal line.

The NHL’s “Best Snow Day Ever” and “Hockey Paradise” are great examples. They didn’t just show numbers. They created worlds where mascots tell data stories and stats become adventures. It’s like Pixar explaining analytics.

A dynamic sports data visualization scene, featuring animated graphs and charts in vibrant colors showcasing statistics like player performance, scores, and game timelines. In the foreground, a sleek, modern tablet displays a 3D interactive visualization of sports data, with glowing neon lines and upbeat motion graphics. In the middle ground, diverse athletes in athletic wear are engaged in various sports, blending seamlessly with the data animations. The background features a stadium filled with fans, under dramatic lighting that enhances the excitement of the visual display. The atmosphere is energetic and engaging, capturing the essence of sports and technology coming together. Use a wide-angle lens to create depth, focusing on vibrant colors and energetic contrasts throughout the composition.

What makes some animations stand out? Trajectory lines that show a puck’s path. These lines are not just lines. They are the brushstrokes of athletic genius, revealing the hidden geometry behind every perfect shot.

Heat maps reveal patterns like digital fingerprints. They show where magic happens on the ice or court. This creates those “aha!” moments when viewers understand why certain players dominate specific zones.

Player movement visualizations deserve their own hall of fame. When done right, they turn athletes into living abstract art. Their movements create patterns that would make Jackson Pollock nod in approval.

The secret sauce? Balancing information with entertainment. Your animations should educate like a professor but entertain like a summer blockbuster. It’s that sweet spot where analytics meets art.

Animation Type Best Use Case Visual Impact Score Complexity Level
Trajectory Lines Shot analysis, pass patterns 9/10 Medium
Heat Maps Player positioning, hot zones 8/10 Low-Medium
Movement Visualization Defensive coverage, spacing 10/10 High
Storytelling Elements Engagement, narrative building 9/10 Medium-High

The NHL’s “Harvey’s Mountain Classic” is a perfect example. They turned cold statistics into warm storytelling. They embedded data within mountain landscapes and character journeys. Suddenly, scoring percentages became part of an epic tale.

Remember: great sports data animation makes people want to look at statistics. It creates visual impact that transforms armchair analysts into engaged fans. When your animations make complex data feel like the climax of a sports movie, you’ve scored the winning goal.

The ultimate test? If someone who hates math suddenly cares about shooting percentages because your visualization told a compelling story. That’s when you know you’ve achieved maximum visual impact.

Timing & Pacing Visuals

Timing is key to making animation in sports slides work. If you mess up, it’s like a fast-paced mess. But get it right, and you create a beautiful dance of data.

The NHL knows how to time their animations perfectly. They match their animation with live games, creating a perfect flow. It’s like the animation is the wine to the game’s food.

Pacing is all about rhythm in your animation in sports slides. Quick cuts are great for exciting moments. Slow reveals are perfect for complex stats. Pauses let viewers absorb the info.

Animation tempo should match the sport’s rhythm. Basketball needs fast edits, while baseball is better with slower pacing. Hockey is somewhere in between.

Great visuals work like a conductor, knowing when to highlight certain elements. It’s not just what you show, but when you show it. The anticipation before a key stat can be more powerful than the stat itself.

Here are some pacing techniques for your next sports presentation:

  • Quick cuts (under 2 seconds) for exciting moments and highlights
  • Medium pacing (3-5 seconds) for main statistics and comparisons
  • Slow reveals (6+ seconds) for complex data that needs digestion
  • Strategic pauses between animation sequences for mental processing

The NHL’s approach goes beyond live games. They offer on-demand content on YouTube and NHL.com. This way, viewers can watch at their own pace.

This isn’t just about making pretty graphics. It’s about creating an emotional journey through data. The right timing builds anticipation. The perfect pace creates understanding. When you sync your animation in sports slides with the game’s rhythm, you tell a story that resonates.

Avoiding Overkill

Ever seen someone discover PowerPoint animations for the first time? It’s like giving a toddler a paintball gun – colorful chaos everywhere. The urge to use every effect is strong, but only pros know when to stop.

I’ve seen presentations so full of motion graphics they could cause epilepsy. Remember, animation is like seasoning, not the main dish. The NHL gets it right by using movement to clarify, not confuse.

A sleek, modern workspace setting in the foreground, showcasing a series of animated motion graphics displayed on multiple monitors. The graphics represent various sports data visualizations, using restrained color schemes and simple yet effective transitions. In the middle ground, a focused professional in business attire interacts with the graphics, his expression reflecting concentration and creativity. The background features a bright, airy office with abstract sports-themed wall art and soft natural lighting filtering through large windows, enhancing the dynamic yet balanced atmosphere. The composition should convey a sense of sophistication and restraint, emphasizing the importance of clarity in visual communication without overwhelming the viewer. Use a wide-angle lens to capture the entirety of this engaging yet composed scene.

Think of VR training’s limits. After 30 minutes, users get sick. Heavy equipment strains the neck. And without haptic feedback, fine motor skills training is tough. These issues show our senses have limits.

Your audience has limits too. Too much visual stuff and they’ll tune out. The goal is to find that perfect spot where motion graphics enhance the message without overpowering it.

Here’s what over-animation looks like in practice:

  • Text that spins, flashes, and fades all at once
  • Transitions that are more complex than the content
  • Charts that animate so much they hide the data

The best motion graphics are often the ones you barely notice. They guide your attention without demanding it. Like good editing in film, the best work blends into the story.

Ask yourself: does this movement help understanding? Or am I just showing off? Sometimes, the most powerful statement is a perfectly steady data point.

Quality motion graphics work like a great bassline – you feel it more than hear it. They set the rhythm without taking over the melody. Your content should always be the main singer.

Remember that scene in Bull Durham where Crash teaches Nuke about clichés? “Don’t try to strike everybody out.” The same goes here. Don’t try to animate every element. Strategic movement is better than constant motion.

The best presentations use motion graphics like a scalpel, not a sledgehammer. They cut through noise, not create more. Your audience will appreciate the clarity.

Audience Response

Does animated content really make a difference with real people? The numbers say yes, loudly.

The NHL’s animated shows now reach over 670 million fans every year. This shows that using visual impact wisely can connect with people. They’re not just showing hockey stats; they’re building fans worldwide with smart animation.

Something interesting happens in how people react to animation. First, animations grab your attention with movement and color. Then, they share insights that really stick.

Different people like different things. Kids love mascot adventures, while analysts enjoy deep data visualizations. Casual fans want stories that turn numbers into tales.

When you tailor animations for each audience, you create a stronger visual impact. It’s like having a personal conversation, not just shouting in a crowd.

Studies show animated content gets shared more, remembered longer, and understood better than static stuff. People aren’t just watching; they’re engaging, processing, and remembering.

Learning Resources

Ever tried explaining a triple option play with static diagrams? It’s like trying to teach quantum physics with cave paintings. The good news? You don’t need an MFA in animation to make your sports slides move.

I’ve tried everything from formal programs to “guerrilla learning” tools. VANAS Online Animation School offers structured programs in Animation, Visual Effects, and Video Games. It’s like the West Point for digital creatives. But what if you need results by next Tuesday’s team meeting?

Tactic3D’s free apps are perfect for sports professionals. They’ve made learning animation fun. Their method? Teach through doing, not just talking. You’re not learning to draw Mickey Mouse. You’re learning to make a football play look like it’s exploding off the screen.

The magic starts with their pre-built templates. Learn how they made a baseball pitch look dramatic or a basketball play unfold in slow motion. It’s like learning music by playing along with songs, not reading sheet music.

Their targeted ads for sports networks show they get their audience. These tutorials aren’t generic. They’re made for coaches, analysts, and broadcast pros who need to share complex athletic data.

The best resources speak your language. You’re not looking for fluff about animation history. You need to know how to make a zone defense look clear to executives who haven’t played sports in years.

Many platforms now offer sports-specific training that gets our unique challenges. How do you show player movement without chaos? How do you highlight key data points without boring everyone?

The real education begins when you stop watching and start doing. Start with simple animations – a arrow showing player movement, a highlight circle for a key moment. Gradually get more complex. Before you know it, you’ll be creating animations that make John Madden’s telestrator look quaint.

Remember: the goal isn’t to become Pixar’s next director. It’s to make your sports presentations so compelling that even the team owner gets why that third-down play call failed. Now that’s what I call a winning animation strategy.

Conclusion

We’ve moved from simple diagrams to exciting experiences that engage both sides of the brain. The NHL’s investment in animated programs is more than just better visuals. It’s a big change in how we tell sports stories.

David Lehanski, NHL Executive VP, hit the nail on the head. He talked about using data visualizations to break new ground in creativity and tech. This isn’t just about growing hockey fans. It’s about changing how we share sports news.

Great motion graphics help us remember through visual impact. They turn complex data into stories that stick with us longer than just numbers.

We’re not replacing old ways of analyzing sports. We’re making them better with engaging tools. The future is for those who see motion graphics as more than just pretty pictures. They’re a way to share information.

As tech gets better, our creativity is the only thing holding us back. Animation beats static numbers every time. It brings sports data to life in a way that numbers can’t.

Cloud-Based Tools for Collaborative Sports Presentations

Watching sports executives give PowerPoint presentations is as exciting as watching paint dry during a hockey intermission. I’ve seen more excitement in a scoreless tie than in most sponsorship decks I’ve seen.

The digital age needs more than static slides. It demands immersive experiences that make sponsors feel like they’re already in the luxury suite. We’re talking about shifting from boring bullet points to dynamic storytelling that actually moves revenue needles.

The old ways aren’t just outdated – they’re actively costing teams partnerships and ticket sales. It’s time to address why your current presentation strategy might be the weakest link in your revenue chain.

Enter cloud collaboration platforms like Google Slides. They’re not just presentation technology tools – they’re game-changers for remote teamwork that keeps everyone on the same playbook, even when they’re miles apart.

Google Slides, Microsoft 365, & Others

Imagine a Broadway show with community theater props. That’s what happens with generic platforms for sports presentations. Google Slides and Microsoft 365 are okay for meetings but fail for big sponsorship pitches.

These tools don’t have the special features needed for standout presentations. It’s not just about templates.

Modern sports presentations need more than what generic platforms offer:

  • 360° venue views to show sponsors where their brand will be
  • Automated logo placement for consistent branding
  • Real-time analytics to track when attention is lost
  • Cloud-based collaboration for team sync

The difference between “good” and “great” is huge. Your sponsorship revenue shows this difference better than any spreadsheet. Traditional platforms are basic but miss the mark for sports presentations.

Platforms like Edison OnCloud show the future of sports presentations. They know it’s not just about sharing info. It’s about creating experiences that turn prospects into partners.

Would you go to a gunfight with a knife? Then why use basic tools for huge sponsorship deals? The right platform does more than show info. It tells a story, grabs attention, and seals deals.

Assigning Roles & Feedback

Ever try to manage a team where everyone played the same role? That’s like creating presentations without roles. Now, with modern tools, you can pick your team’s lineup with ease.

With clear roles, the confusion of overlapping work is gone. Design handles visuals, analytics works on numbers, and sales works on deals. No one steps on anyone’s toes anymore.

A modern conference room setting filled with diverse professionals in business attire, actively engaging in a collaborative sports presentation. In the foreground, a large digital display showcases a color-coded role assignment chart with various sporting icons. In the middle, a group of three individuals (one woman and two men) are pointing at the chart, discussing responsibilities with focused expressions. The background features a glass wall that overlooks a field, emphasizing an athletic atmosphere. Soft, natural daylight pours in from the windows, creating a vibrant and inviting ambiance. The scene is captured with a wide-angle lens to highlight the collaborative environment, with a slightly blurred background to keep attention on the discussion in the foreground. The mood should convey teamwork, engagement, and professionalism.

Feedback has changed from a slow process to something smooth. Real-time comments mean quick feedback, not long email threads. Teams can now cut down on revisions from days to hours.

Spiideo’s tools show how collaboration has changed. Coaches can draw up plays together, no matter where they are. It’s like sketching out a defense while your assistant adds to the offense at the same time.

Edison OnCloud takes it even further with real-time collaboration. Many can edit the same part of a presentation without any issues. It’s like having your whole team working from the same playbook.

When roles and feedback work together, teams become more efficient. Your sponsorship team can adjust prices while your creative team updates visuals. Analytics can tweak stats, and production can polish the presentation. All at the same time.

This isn’t just about being efficient; it’s about working together smoothly. Teams that get this right move forward like a well-oiled machine. They avoid mistakes and keep the game moving.

The outcome? Presentations that feel like they’re part of a single story, not just a bunch of parts thrown together. And you save time that you can use for strategy, not just dealing with paperwork.

Version Control Best Practices

Version control in sports presentations is like having a time machine that only goes forward. But somehow, people keep messing with the timeline. It’s like showing up to the Super Bowl with last year’s playbook.

Automated cloud storage and real-time syncing are the magic. Imagine your presentation updating itself with current stats faster than a rookie running the 40-yard dash. No more embarrassing moments showing retired players to new sponsors.

Template management systems offer “controlled creativity.” They’re like giving your team a playbook where they can call audibles without breaking formation. The templates enforce brand guidelines while allowing customization – think of it as creative freedom within guardrails.

Here’s the beautiful part: when every presentation automatically updates with current stats, player photos, and sponsorship opportunities. It’s like having an automated bench that knows exactly when to sub in fresh content. The system does the heavy lifting while your team focuses on strategy.

Proper document version control best practices ensure your brand integrity remains intact through rapid iterations. It’s not just about avoiding mistakes – it’s about maintaining professional consistency across every touchpoint.

The best systems create an ecosystem where creativity and control coexist peacefully. They prevent the digital equivalent of wearing the wrong colors on game day while letting your team’s innovative spirit shine through.

Real Examples

If you’re using static slides for sports presentations, you’re lagging behind pro teams. Almost half of NHL, NFL, NBA, MLB, and MLS teams have moved to platforms that boost revenue. This change is more than an upgrade; it’s a game-changer.

Teams now use tech to show sponsors how their logos will look on various surfaces. From LED ribbons to jersey patches, these tools create detailed visuals that seal deals. One team saw a 30% increase in renewals with 360° virtual tours. Sponsors could explore the stadium from their office.

A dynamic sports presentation scene set in a modern conference room. In the foreground, a diverse group of four professionals, dressed in smart business attire, are engaged in an animated discussion around a large touchscreen display showcasing interactive sports analytics and visuals. The middle ground features a sleek round conference table with laptops, notes, and digital tablets scattered about, highlighting collaborative efforts. In the background, large windows allow natural light to flood the space, providing a view of a vibrant sports complex. The atmosphere is energetic and focused, conveying teamwork and innovation in sports presentations. Use soft lighting for an inviting ambiance and capture the scene from a slightly elevated angle to encompass the entire environment.

The time savings are huge too. Another group cut proposal time from days to minutes with CRM automation. Their sales team can create custom packages quickly. These changes aren’t just theoretical; they’re real wins that set teams apart.

DIGIDECK’s platform helps 50% of major league teams with sales, premium seating, and renewals. The proof is clear and strong. Teams using these platforms aren’t just improving their presentations; they’re growing their businesses.

In this article, we explore how advanced broadcasting technology is transforming sports presentations and helping teams move beyond static slides toward dynamic, data-driven platforms. The move from traditional presentations to interactive systems is more than just a technological upgrade—it represents a new way for sports organizations to showcase their value.

Those that have already embraced these tools are seeing measurable results. From stronger sponsorship pitches to improved fan engagement and premium seat renewals, the benefits go far beyond visual appeal. For many organizations, the shift has become a strategic advantage, allowing them to communicate insights, performance metrics, and commercial opportunities more effectively.

The teams that made the transition early are now focused on expanding their success, leveraging modern presentation platforms to drive revenue and build stronger relationships with partners and fans alike.

Tips for Security

Do you think your presentation security is strong? Think again. Leaking a sponsorship proposal is like giving your playbook to your opponents. It’s not just embarrassing; it’s a serious threat to your revenue.

Modern cloud security isn’t about building walls. It’s about creating smart barriers that protect without slowing you down. The best systems know how to balance collaboration and security.

Enterprise-level security changes how you manage your content. Who can see your presentation? For how long? With what editing rights? These are key questions for your defense.

Granular access control is what separates amateur from professional setups. It’s like giving someone keys to your whole office versus just the conference room. Subscription-based models like Edison OnCloud make adjusting permissions easy.

Consider these critical security layers:

Security Feature Basic Systems Professional Solutions
Access Duration Control Limited or none Precise time windows
Editing Privileges All-or-nothing Role-based permissions
Forwarding Prevention Rarely available Built-in protection
Compliance Tracking Basic logging Detailed analytics

Proper analytics complete your security system. You’ll know right away if your proposal is shared with competitors. It’s not paranoia; it’s smart business.

DIGIDECK’s compliance features show how serious operations protect their data. They build systems that would impress any defensive coordinator. Every interaction and access point is monitored.

Your intellectual property needs more than just basic password protection. It needs smart security that fits your workflow. In business, the best defense isn’t just a good offense; it’s smart access control.

Conclusion

So, we’ve reached the end of our discussion on sports presentation technology. It’s not just about which slide deck looks better. It’s about choosing between tools that make money and those that just sit there.

The right cloud-based tool can change your sales game. DIGIDECK is leading the way for sports groups, with sales tools, analytics, and automation. It makes your sales smarter, faster, and more effective.

Whether you’re a small team or a big league franchise, new tech can change how you share your story. The real question is, will you keep using old tools or join the big leagues?

The game has changed. Your presentation tech should too.

How to Use Real-Time Data to Power Dynamic Presentations

Let’s be honest – showing old data in 2024 is like using a flip phone at a cyberpunk convention. It’s not just outdated; it’s ancient.

I’ve seen presentations fail because they used old numbers. People today live in TikTok time. They expect your insights to change and grow during your talk.

Turning numbers into visual stories is key. It’s not just corporate talk – it’s the difference between a good story and old news.

Proper data visualization doesn’t just make your presentation better. It makes you seem like a psychic who did their homework. And in today’s world, that’s the only magic that counts.

Tools for Displaying Live Data

In the world of real-time data, your choice of tool shows your analytical style. Let’s look at the top live stats tools that make numbers tell stories.

Excel embedding is your go-to for solid live stats without fuss. It’s not fancy, but reliable. Think of it as your all-nighter coffee buddy.

PowerPoint’s linking options are more flexible than you think. You can connect to databases and APIs easily. It’s simple and direct, no extra help needed.

DataPoint add-in turns PowerPoint into a data powerhouse. It makes dynamic charts from various sources. It’s not just showing numbers; it’s creating a data world in your slides.

Power BI and Tableau are the big guns. The Power BI add-in for PowerPoint embeds visuals and reports. It’s like having a data center in your presentation.

AiPPT is the new kid on the block. It uses AI to create slides with real-time data. It’s like having a data scientist and designer in one service. It’s perfect for those who want impressive live stats without the hassle.

Don’t forget about direct URL linking and shareable links. Sometimes, the simplest way is best. It’s like farm-to-table dining – fresh and direct.

Tool Best For Integration Level Learning Curve
Excel Embedding Basic data updates Direct integration Low
PowerPoint Linking Web data sources Native functionality Medium
DataPoint Add-in Multiple data sources Advanced integration High
Power BI Integration Enterprise analytics Seamless embedding Medium-High
AiPPT Platform Automated design AI-powered generation Low

Each tool has its own strengths for live stats presentations. The right one depends on your needs and how you want to impress. Your choice reflects your presentation philosophy more than your LinkedIn bio.

The best tool makes your data shine while keeping you calm. Whether you’re a spreadsheet expert or an AI fan, there’s a live stats solution for you. It can turn your presentation from ordinary to outstanding.

How to Use APIs/Exports

Welcome to the digital séance where APIs let your slides converse with live data sources. This isn’t your grandfather’s copy-paste operation. We’re talking about presentations that breathe with current information.

PowerPoint’s Insert tab hides a secret portal to the data universe. Think of it as the diplomatic embassy between your slides and external databases. You’re not just embedding numbers – you’re establishing diplomatic relations with information streams.

Here’s the beautiful paradox: your data lives elsewhere but performs locally. Power BI’s export feature lets you showcase real-time dashboards while keeping sensitive information securely locked away. No data actually enters PowerPoint – it’s like having a window that shows the weather without letting in the rain.

The API approach transforms your presentation into a conversation. You ask polite questions through queries and receive JSON responses that make your real-time dashboards look brilliantly informed. It’s the difference between reading yesterday’s newspaper and having a live correspondent in the field.

Security? Power BI handles it like a Swiss bank vault. Your data stays protected while your audience sees only what you want them to see. This separation of church and state – data storage versus presentation – is what makes modern real-time dashboards so powerful yet secure.

Remember the golden rule: garbage in, gospel out. Clean APIs feeding well-designed real-time dashboards create presentations that feel less like reports and more like revelations. Your data doesn’t just sit there – it performs.

The export function works like a carefully choreographed dance. Data moves from secure repositories to beautiful visualizations without ever being truly exposed. It’s the digital equivalent of showing someone a masterpiece through bulletproof glass.

These tools separate data tourists from digital natives. While beginners struggle with static charts, pros build living real-time dashboards that update before your audience’s eyes. The magic happens in the connection, not the content.

Your presentation becomes a living document, constantly refreshed from the data firehose. It’s like having a news ticker built into every chart and graph. The information stays current without you lifting a finger after setup.

This approach transforms boring reports into dynamic storytelling. Your real-time dashboards don’t just display numbers – they narrate the ongoing story of your data. The audience sees the plot unfolding in real time.

Custom Dashboards

Let’s explore how raw numbers become visual art. Custom dashboards turn data visualization into a form of art. It’s like the difference between reading a spreadsheet and watching a Broadway show.

Tools like Power BI and Tableau do more than show numbers. They create dynamic presentations that engage your audience. It’s like having a conversation with your data, not just lecturing it.

  • Interactive elements that invite exploration
  • Clean design that highlights what matters
  • Real-time updates that keep things current
  • Custom filters that answer specific questions

Power BI takes it up a notch. You can set the page to your desired state with filters. It’s like being a data DJ, mixing the perfect track.

AiPPT adds more with templates and customization. Imagine tailoring your presentation like a Savile Row suit – perfect fit, impeccable style. No more one-size-fits-all solutions that look like they came from a discount rack.

The best custom dashboards are like James Bond – sophisticated, responsive, and revealing exactly what needs to be known at precisely the right moment. They don’t just show data. They tell a story.

Good data visualization isn’t about fancy graphics. It’s about clarity. It’s about making complex information understandable at a glance. Your audience shouldn’t need a decoder ring to understand what you’re presenting.

Remember: a poorly designed dashboard is like a mime performance – confusing, frustrating, and everyone wishes it would end. But a well-executed one? That’s pure magic.

Interpreting the Stats

Most presenters mess up data interpretation like a toddler with paint. They make a mess and don’t focus. But, turning raw numbers into stories that matter is the real magic.

Before you start, check your data sources. Wrong live stats can ruin your credibility fast. Ask if the data is current and reliable. Would you trust these numbers with your reputation?

A modern, sleek live stats interpretation dashboard displayed on a large screen in a sophisticated conference room. In the foreground, a detailed view of colorful graphs, charts, and real-time data visualizations, showcasing statistics such as line graphs and bar charts. In the middle ground, a diverse group of professionals in business attire attentively analyzing the data, with a mix of expressions reflecting insight and discussion. In the background, large windows provide a panoramic view of a cityscape during the day, with bright natural light illuminating the space. The atmosphere is dynamic and focused, conveying a sense of urgency and collaboration, while maintaining an organized and high-tech aesthetic. The composition emphasizes clarity and professionalism, with deep shadows giving a subtle depth.

Knowing your audience is key. Are you speaking to executives or analysts? Your story should match their needs.

Every number needs context. A 15% increase is just a number without context. You must explain why it’s important.

Data Interpretation Framework

Data Point Raw Stat Basic Interpretation Compelling Story Angle
Website Traffic 15,000 visitors Traffic increased today Our campaign generated 50% more engagement than industry average
Conversion Rate 3.2% Conversions are steady We’re converting at premium rates despite market downturn
Social Engagement 2,500 shares Content is being shared Our message resonates 3x more with millennials than competitors
Revenue Impact $45,000 Revenue generated Real-time adjustments drove 28% higher ROI than forecast

The best live stats interpretations follow three rules. Know your audience, have a clear message, and tell a story. You’re like a data DJ, mixing numbers into something interesting.

No one cheers for a spreadsheet. But, they’ll applaud the insights you share. Your live stats should answer questions your audience hasn’t thought of.

Great data storytelling turns numbers into stories and metrics into meaning. This is what keeps people engaged, not bored.

Combining with Video

Why stick to spreadsheets when you can make data into a movie? Adding video to your data makes it exciting and grabs attention.

Think back to the last sports game you watched. The scoreboard updated live as the game went on. That’s what we’re talking about – combining different types of information smoothly.

When your real-time dashboards match up with video, magic happens. Imagine showing off quarterly results with a live factory feed. Or showing software performance with real user actions.

This isn’t just about looks. Our brains get visual info 60,000 times quicker than text. Mixing video with changing data speaks directly to your audience.

Here’s how to do it right:

  • Choose platforms that show data and video at the same time
  • Match your data updates with key video moments
  • Make sure both elements look good together
  • Test everything before you go live

For more complex projects, like mixing telemetry data with video, the rules are the same. Focus on making it work smoothly, not on fancy looks.

You don’t need a big budget for this. Most tools and platforms can handle basic video integration. The real work is in planning how your data and video will work together.

Remember, your audience’s attention is priceless. Using real-time dashboards with video isn’t just for show. It shows you value their time and intelligence.

Troubleshooting Live Feeds

Ever had your perfect data visualization suddenly go dark during a key presentation? It’s like your car breaking down on the freeway during rush hour. Technology often fails at the worst times.

The “Cannot run Power BI” error is like a flat tire in the corporate world. They don’t tell you in the fancy tutorials that you might need WebView2 installed. It’s like needing a special key to start a car you already own.

A focused scene depicting a data visualization troubleshooting session in a modern conference room. In the foreground, a diverse group of professionals in smart business attire intently analyzes a large digital screen displaying a chaotic mix of colorful graphs and real-time data streams, with some indicators flashing red. In the middle ground, an open laptop shows a dashboard with error notifications alongside a whiteboard filled with technical notes and flowcharts. The background features large windows allowing natural light to illuminate the workspace, complemented by sleek furniture and digital devices. The overall mood conveys a sense of urgency and collaboration, emphasizing problem-solving in a high-stakes environment. Soft lighting highlights the concentration on the team’s faces, with a wide-angle view to capture the full scope of the troubleshooting effort.

Admin-managed add-in issues are another classic headache. Imagine building a whole presentation only to find out your tools need permission from IT. It’s a mix of bureaucracy and technology gone wrong.

Here’s my battle-tested approach to keeping your data visualization alive:

  • Set automatic refresh intervals – because manually updating feels like constantly checking if your coffee is hot
  • Implement data validation techniques – your safety net against showing yesterday’s stock prices today
  • Always have a backup export ready – the digital equivalent of keeping a printed map in your glove compartment

The real secret? Troubleshooting is 10% technical knowledge and 90% keeping calm when technology rebels. I’ve seen beautiful dashboards show prehistoric data during investor meetings. The lesson? Technology has a sense of humor, and you’re usually the punchline.

My philosophy? Build your data visualization with the assumption that something will eventually break. Because in the world of live feeds, it’s not about if problems will occur – but when. The prepared mind survives the digital wilderness.

Conclusion

We’ve explored the tools and methods that make live stats essential. From built-in tools to platforms like AiPPT, each has its own way to keep your data current and your audience interested.

Real-time data is more than just numbers. It’s dynamic and alive. By presenting it clearly, you turn data into stories. This makes your presentation interactive and timely. Modern platforms, including  next-gen media streaming solutions , make it possible to deliver live statistics, instant updates, and visual insights to audiences in real time.

The aim isn’t to find the latest tool. It’s to grasp the essence of your data. In today’s fast-paced world, live stats are key. They make your content more relevant and keep people’s attention.

Now, it’s time to bring your data to life. Let it tell its story. Your audience is ready to listen.