Category Archives: Visual Techniques

Film That Teaches: Incorporating Video Clips the Right Way in Team Meetings

Ever seen a movie scene that perfectly showed a leadership moment? That’s the power of film. It turns complex ideas into moments we can see, feel, and remember. This visual, concise storytelling makes lessons stick.

The most important principle is: shorter is almost always better. Why? Our brains can only absorb so much at once. Concepts like “cognitive load” and “focus windows” explain our limited attention span.

A sharp, 30-second clip from a film like Remember the Titans can teach a lesson better than a 20-minute talk. It’s like a concentrated dose of insight. It respects your group’s mental bandwidth and prevents overload.

This method isn’t just about saving time. It’s about making learning stick. We’ll explore the “why” behind this method and show you how to do a proper video breakdown that engages everyone. Ready to learn from the movies?

Sourcing Clips: game, practice, scout, exemplar pros

You don’t need a Hollywood budget to find great teaching clips. Some of the best material is already at your fingertips. Let’s explore the four main sources where you can find those short, impactful moments that make lessons stick.

Building your video library is like a prospector searching for gold. You have four rich territories to explore:

  • Your own game or work footage
  • Dedicated practice sessions
  • Scouting other teams or competitors
  • The world of film and professional exemplars

Your own footage is a treasure trove of real, immediate examples. This is video from your actual performances or projects. The power here is personal relevance. Players or team members see themselves, making the feedback direct and undeniable.

Practice session video offers a clean, focused look at isolated skills. The pressure is lower, so you can find perfect examples of technique or effort. It’s the ideal place to clip a model repetition of a drill or a moment of excellent communication.

Scouting footage provides an invaluable external perspective. By reviewing competitors or industry leaders, you can highlight both what to do and what to avoid. It turns an opponent’s strength into a teachable moment or uses their mistake as a cautionary tale.

Film and pro exemplars tap into universal storytelling. This is where we can learn from the best in any field. Movies are packed with archetypal lessons. Is it a 20-second scene showing gritty determination, like Tiana working tirelessly in The Princess and the Frog? Or a quick clip of adaptive leadership, like Captain Li Shang training Mulan?

Great clips from any source share a common trait: they show one idea clearly. Look for that 20-to-40-second moment where a single behavior is on full display. It could be Aragorn’s speech uniting the armies (shared purpose), the perseverance of Rudy, or the courage of Merida in Brave.

Your job is to spot these golden nuggets. Whether it’s a player’s effort on tape or a pro’s decision in a highlight reel, you’re collecting the raw material. This is the essential first step to building a focused, effective clip playlist that drives learning and leads to more impactful meetings.

Build a Playlist: theme, 5–7 clips, 20–40 sec each, title slates

Imagine your team meeting as a film school session. Each clip in your playlist teaches a chapter of a larger lesson. A single video is powerful, but a curated playlist turns isolated moments into a complete learning journey. It’s like directing a short documentary for your team!

Your first step is choosing a tight, focused theme. This is your playlist’s backbone. Great themes often come from core leadership lessons—like building trust, navigating conflict, or providing inspiration. You can also build around character qualities, such as grit, perseverance, or courage. This focus ensures every clip serves the same master idea.

Next, select 5 to 7 clips that each explore a different facet of your theme. If your theme is “Quiet Leadership,” one clip might show a character listening intently, while another demonstrates leading by example without words. This variety keeps engagement high and covers the concept thoroughly.

Keep each clip crisp—between 20 and 40 seconds. This is the sweet spot! It’s long enough to convey a meaningful moment but short enough to maintain razor-sharp focus. Remember Katniss’s silent salute in The Hunger Games? That’s the impactful brevity you’re after.

A stylish, modern office conference room, focusing on a large screen displaying a colorful video playlist with energetic clips about teamwork and creativity. The foreground features a sleek wooden table set with professional laptops and notepads, conveying a collaborative environment. In the middle ground, several diverse professionals dressed in business attire are engaged in discussion, pointing at the screen, with expressions of interest and enthusiasm. The background shows floor-to-ceiling windows allowing soft natural light to flood the room, enhancing the warm, inviting atmosphere. The overall mood is dynamic and focused, with a composition that emphasizes teamwork and the utilization of multimedia in meetings, framed from a slightly elevated angle to capture the participants’ engagement with the playlist.

Before each clip plays, use a simple title slate. A title slate is just a text screen that primes your team for what they’re about to see. For example: “Self-Belief: The Karate Kid” or “Team Trust: Remember the Titans“. This small act tells your team, “Here’s what to look for,” and dramatically boosts retention.

Let’s look at how this comes together. The table below shows sample clip playlist themes built from common leadership and character ideas.

Theme Core Idea Example Clip (Movie) Clip Focus (20-40 sec)
Overcoming Adversity Pushing through extreme challenges Rocky Rocky’s grueling training montage
Quiet Leadership Leading through action, not words Hidden Figures Katherine Johnson quietly solving a critical math problem
Building Trust Establishing reliability in a team Apollo 13 Engineers collaborating to “build a filter” with limited parts
Moral Courage Doing the right thing under pressure To Kill a Mockingbird Atticus Finch’s closing courtroom argument

Building this kind of video playlist requires an editor’s eye. You’re not just collecting cool scenes. You’re sequencing them to build understanding. Start with a foundational clip, add complexity in the middle, and end with an inspirational payoff.

The result? Your team doesn’t just watch a few videos. They experience a narrative arc designed for their growth. A well-built playlist makes the lesson stick, turning your meeting into an unforgettable mini-masterclass.

On-Screen Tools: freeze, telestrate, zoom, side-by-side comparisons

With the right tools, a simple video clip turns into an interactive learning session. It’s like your digital coach’s whiteboard. Your meeting becomes dynamic, and your players become active participants in their own video breakdown.

These tools help you guide eyes to the exact details that win games. Let’s explore the four power tools that will upgrade your film review.

The Freeze Frame: Hit Pause on the Decisive Moment

Great plays often hinge on a single, split-second decision. The freeze frame tool lets you pause the video right on that moment. It’s like freezing the instant Buzz Lightyear devises his plan in Toy Story 2.

You stop the chaos. All eyes are on the screen. Now, you can ask, “What options did she have here?” or “See his body position?” This focused pause creates a powerful teaching anchor.

Telestration: Your Digital Marker

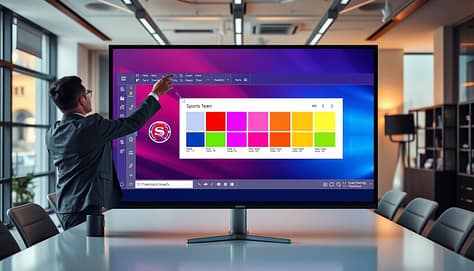
Telestration is just a fancy word for drawing on the screen. And it’s a game-changer! Use it to highlight a player’s cutting route, draw an intended passing lane, or circle a defender’s positioning error.

Instead of just talking about a movement, you can show it. A simple arrow makes a complex strategy instantly clear. This turns abstract concepts into visible, concrete instructions.

Sometimes, the most important action isn’t in the center of the screen. The zoom tool helps you isolate it. Pull in close on a quarterback’s eyes to read his focus. Zoom on a striker’s first touch to analyze foot placement.

This tool cuts out distractions. It forces the team to concentrate on one player, one gesture, or one critical element of the play. You direct the narrative, frame by frame.

Side-by-Side Comparison: The Power of Contrast

This is perhaps the most impactful tool for learning. Place two clips next to each other. On the left, show a common mistake. On the right, show a model execution from your own team or a pro.

The difference becomes undeniable. Players don’t just hear about the right way; they see it contrasted with the wrong way. This visual proof accelerates understanding and buy-in.

To help you choose the right tool for the job, here’s a quick reference guide:

Tool Best For Coaching Question Prompt Impact on Learning
Freeze Frame Analyzing decision points & body positioning at a critical moment. “What is Player A’s best option here, and why?” Creates a shared reference point for discussion.
Telestration Illustrating movement, space, and tactical lanes. “If I draw the ideal path, where should it go?” Transforms verbal instruction into visual guidance.
Zoom Focusing on a specific player’s technique or reaction. “Watch just the feet. What do you notice about the first step?” Eliminates visual noise for precise skill analysis.
Side-by-Side Demonstrating the correct vs. incorrect execution of a skill. “What are two key differences between these clips?” Provides instant, clear visual feedback and correction.

Mastering these tools turns you from a video player into a video director. You’re no longer just watching film; you’re conducting a detailed video breakdown. Each tool gives you a new way to highlight the “why” behind the “what.”

Start with one. Try using the freeze frame in your next meeting. Then, add a little telestration. Soon, you’ll have a full toolbox to make every second of video count.

Teaching Script: see → name → do; cue words and player roles

Ever wondered what to say after hitting play? A simple three-step framework turns watching into learning. The clip ends, and all eyes are on you. This is your moment to teach. Without a plan, that powerful scene can fall flat. With a clear script, it becomes a lesson your team remembers and uses.

We call this script the See, Name, Do method. It’s your blueprint for confident teaching cues. It transforms a cool movie moment into a tangible team behavior.

First, help everyone SEE the key action. Don’t assume they caught it. Rewind and freeze the frame. Point out the specific body language, the timing, or the decision. For example, show Tiana in The Princess and the Frog working tirelessly. The visual of her effort is what you highlight.

Next, give that action a clear NAME. Attach a concept or principle to it. This makes the lesson sticky. From the Tiana clip, you might name it “The Hard Work Principle,” quoting her line: “The only way to get what you want… is hard work.” From an Aragorn speech, you could name it “Leading with Vulnerability.” A name gives your team a mental hook.

Lastly, translate it into what your team should DO. This is the “so what?” Be specific. If the principle is “hard work,” the do might be “finish every drill at full speed, even when you’re tired.” If it’s “vulnerability,” the do could be “speak up in the huddle when you see a problem.” This step closes the loop from inspiration to application.

This structure powers up your teaching cues. Cue words are short, memorable phrases you borrow from the films. When Aragorn says “For Frodo,” your cue might be “For [Teammate’s Name]!” to trigger selfless play. These cues become your team’s shorthand during practice and games.

Link these cues to player roles for maximum impact. A point guard’s cue might be “Eyes up!” from a film character surveying the battlefield. A lineman’s cue could be “Hold the line!” from a shield wall scene. This personalization makes the lesson relevant to each athlete’s job on the field.

Consistency is key. Using the same See, Name, Do script and associated cue words across meetings builds a common language. It turns abstract film themes into concrete, executable behaviors. This method is a core part of developing the key skills for successful sports presentations.

So, build your script. Find the moment, name the lesson, and define the action. You’ll move from just showing a clip to truly teaching with it. Your players will not only see the difference—they’ll live it on the field.

Participation: players annotate, “what would you call?” prompts

Turn your team meeting into a collaborative film studio. Change from presenting to facilitating. Great learning is a dialogue, not a monologue.

This section is about making your players active co-analysts. When they engage with the film, the lessons stick.

A modern team meeting room filled with diverse players in professional attire, actively engaged in video analysis. In the foreground, a large screen displays video clips of game footage where players annotate key moments with digital tablets and pens. The middle ground features a round table with players discussing and collaborating on feedback, highlighting their expressions of concentration and enthusiasm. The background shows large windows letting in soft, natural light that creates a warm atmosphere. The room is decorated with sports memorabilia, and there are motivational posters on the walls. The angle captures both the screen and the players, emphasizing participation and teamwork in the analysis process. The mood is focused and dynamic, showcasing the energy of collaborative learning.

Start by giving them tools. After showing a clip, ask a player to use the telestration features. Ask them to circle the key movement, underline the defensive alignment, or highlight the communication they see. This simple act of doing builds immediate investment.

Then, fuel the discussion with powerful, open-ended questions. Avoid yes/no queries. Instead, prompt deeper thinking with phrases like, “What would you call…”. These questions don’t have one right answer—they start conversations.

Here are a few examples to get you started:

  • “What would you call the leadership style shown in this huddle?”
  • “If you were the director, what title would you give this scene of conflict resolution?”
  • “How would you annotate the body language between these two players?”

Using a classic film clip can make this powerful. Show a scene from Remember the Titans where players overcome bias. Then ask, “What would you call the moment unity clicked for this team?”. You’ll spark a real conversation about trust and common purpose that directly translates to your locker room.

This method works just like using a short film like For The Birds to discuss bullying. The video sets the stage, but the players’ insights drive the lesson home. Your role is to guide their discovery.

This active participation does more than just fill time. It creates ownership. When a player names a concept or circles a mistake themselves, they claim that knowledge. They’re not just hearing your point; they’re making it their own.

So, pause the clip, pass the digital marker, and ask, “What do you see?”. Then listen. The best ideas often come from the team itself.

Export & Share: timestamp notes to position groups

Exporting your session’s highlights makes it a tool for ongoing learning. The meeting doesn’t end when you turn off the projector. Your annotated clips and team insights are valuable for future practice and review.

We’ll show you how to export and share this material. This makes your coaching portable. Players and staff can review key lessons anytime.

The key is creating timestamp notes. These are short labels for specific moments in your video. They’re like chapter titles for your film session.

For example, a note might say: “0:15 – Demonstrates proactive communication before the snap.” Another could be: “2:30 – Shows perfect hand placement technique.” These notes tell viewers what to look for and why it’s important.

These notes are powerful. They turn a general video into a targeted teaching file. You can now share the entire playlist or just select clips with specific position groups.

Send your offensive line clips about coordination and double-team blocks. Share defensive recognition clips with your linebackers. For a project team, share moments that highlight psychological safety and open dialogue.

Here’s a quick look at how to match clip content with the right audience using timestamp notes:

Clip Focus Timestamp Note Example Target Position Group Key Insight for Review
Pre-snap Communication “0:08 – QB points out blitz, OL adjusts.” Quarterbacks & Offensive Line Verbal and non-verbal signals under pressure.
Pursuit Angle “1:45 – DE maintains outside leverage, forces run inside.” Defensive Ends & Linebackers Maintaining discipline in contain assignments.
Screen Pass Timing “3:20 – WR executes crack block, RB follows lead.” Wide Receivers & Running Backs Synchronization between multiple players.
Post-Play Huddle “2:10 – Safety gathers DBs for quick adjustment.” Defensive Backs (Entire Unit) Immediate feedback and correction culture.

Creating these notes is easy. Most video editing or presentation software allows you to add comments or markers. You can also use a simple spreadsheet. List the clip title, the exact time code, and your one-sentence note.

When you export your final playlist, these notes should travel with the file. Many platforms embed them as metadata. If not, include a separate text document. This ensures your context is never lost.

Sharing with position groups becomes a one-click task. You’re not just sending a video file. You’re sending a curated learning module. Players know exactly which moments are meant for them and what to take away.

This method turns a great meeting into a lasting resource. Your teaching points live on, ready to be reviewed before the next practice or game. It’s how you make film study actionable every single day.

Metrics: meeting retention checks, next-game transfer behaviors

Let’s look at real ways to see if your film sessions are working. How do you know your clips are teaching? The answer is in two key metrics: retention checks and transfer behaviors.

Retention checks are quick quizzes at the start of meetings. They check if the main lesson was remembered. For example, you might ask, “Quick recap: what was our one-word takeaway from the Moana clip about perseverance?”

This creates a strong feedback loop. You quickly see what was remembered and what wasn’t. It’s not about grading, but checking if your teaching was clear.

The more exciting metric is transfer behaviors. This is the top prize. It’s about seeing actions in the next game or project that show the lesson from your clip. Did a player show new resilience, like Rudy Ruettiger fighting for his spot? Did a team member lead in a big moment, like Harry Potter accepting his role?

Tracking these moments shows the real value of your film sessions. It tells you which themes are working and which need more work.

This ongoing feedback loop makes teaching based on data, not guesses. For more on measuring what sticks, check out tracking retention in professional analytics.

Metric Type Method Key Question Outcome
Retention Check Verbal recap or quick quiz at the next meeting. “What was the main lesson from last session’s clip?” Measures immediate understanding and recall.
Transfer Behavior Observation during live games or projects. “Did I see the clip’s lesson applied in action today?” Measures real-world application and skill transfer.
Feedback Loop Combine data from both checks and behaviors. “What should our next clip theme be based on this data?” Strengthens the feedback loop and guides future teaching.

Start simple. Pick one clip and look for one transfer behavior this week. When you find it, name it and celebrate with your team. This shows everyone that the film study is making a difference.

Troubleshooting: audio levels, lag, codec, room sightlines

Your video playlist is ready. Your teaching script is polished. But what happens when the tech doesn’t cooperate? Don’t let a glitch steal the spotlight from your lesson. A few simple checks can save your meeting.

Start with sound. Muffled dialogue ruins a clip’s impact. Before the meeting, use a media player like VLC to check audio levels. Run a quick soundcheck. Ensure every whisper from your exemplar clip is as clear as a coach’s instruction on the field.

Video lag or a missing codec error can freeze your session. For smooth playback, download clips to your local drive instead of streaming. Use a reliable player like QuickTime Player or VLC, which handles most file formats. This prevents the dreaded buffering wheel during a critical play analysis.

The human setup matters just as much. Check the room sightlines. Can players in the back see the screen? Arrange seating in a semi-circle. Position your monitor so everyone has a clear view. Good sightlines keep eyes on the film, not on the wall.

With these fixes in your toolkit, you can solve problems quickly. You keep the focus where it belongs: on learning from the game. Now, go teach with film.


Infographics for Sports Presentations: Make an Impact With Data Visuals

The usual post-game analysis or strategy meeting can be dull. It’s like looking at a deflated football. We’re surrounded by spreadsheets and bullet points, a data overload.

But what if your numbers could be the star player? What if they could command the room like a last-minute touchdown?

The secret weapon is sports data visualization. It’s like a highlight reel for your stats. It’s not just about making things look good. It’s a smart strategy.

Research shows visuals like charts and graphs can boost readership by 80%. For journalists and coaches, being first isn’t enough. You need to be memorable.

This is about smartening up your communication, not making it simple. It’s about turning complex info into a story. Ready to see your data get the applause it deserves?

What is a Sports Infographic?

Imagine a coach’s whiteboard meets a graphic designer’s toolkit. That’s how you get a sports infographic. It’s a visual masterpiece, blending a chart, poster, and mini-documentary. It’s not just any graph; it’s a graph on a stadium backdrop.

Player icons are all over the field. Key takeaways are highlighted like a play-by-play. This is what makes infographic slides so powerful.

They tell a story. It’s like the whole season’s journey, from hard preseason drills to winning the championship. It’s shown through timelines, heat maps, and detailed shot charts.

Venngage shows how to make sports exciting with dynamic design. It’s a single canvas that shares game stats, training routines, and tournament insights. It turns athletic data into a visual story.

What kind of data? All of it. From possession stats to heart rate zones, it’s all there. The infographic makes it all meaningful.

Modern sports technology is also expanding the types of insights teams and analysts can visualize. Platforms used for custom sports betting platform development often rely on advanced data visualization, real-time statistics, and performance analytics. These same principles can be applied to infographic slides, helping coaches and analysts transform complex game data into visuals that are easy to understand.

This skill is not just about making things look good. It’s about communicating creatively through infographics. It’s about tracking stats, highlighting achievements, and breaking down strategies in a way that sticks.

Choosing the Right Data for Visuals

Ever seen a coach cover a whiteboard in stats until it looks like art? That’s what happens when you skip data curation. You have more numbers than a Wall Street trader, but your task is to edit.

Think of yourself as a producer of a highlight reel, not a keeper of the whole game film. Every data point should pass the “So What?” test. A bar graph of player heights is just a fact. But a line chart showing your team’s height compared to opponents in the next series? That’s a strategic point.

The most essential information deserves the spotlight. Is it the rookie’s surprising improvement in free-throw percentage? Or the defense’s collapse in the final quarter? Start there. If a statistic doesn’t support your main argument or show a surprising insight, skip it. Your audience’s attention is limited—don’t waste it.

This is where presentation charts are key. They are your storytelling tools. A well-chosen chart can tell the story before you even speak.

Minimizing text is a must. Use icons for quick visual cues. A football icon for offense, a stopwatch for time, a flag for international players. These symbols save space and are processed fast. Your goal is clarity, not clutter.

To make the curation process clear, let’s look at what data makes the cut and what doesn’t.

Data Point Typical Chart Narrative Power When to Bench It
Player Points Per Game (Season Avg.) Bar Chart Low. It’s a basic stat. When presented alone. Instead, layer it with efficiency metrics.
Team 4th Quarter Scoring vs. League Average Line Graph with Trendline High. Reveals clutch performance or late-game fatigue. Almost never. This is a core strategic insight.
Fan Attendance by Game Day Pie Chart Medium for business ops; Low for coaching staff. In a pure game-strategy meeting. Know your audience.
Player Speed & Distance Covered (GPS Data) Heat Map Overlaid on Field Very High. Shows movement patterns and work rate visually. If the visualization is too complex. Simplify the heat map zones.

Notice a pattern? The best data for presentation charts has contrast, reveals a trend, or highlights an anomaly. It answers a “why” or a “how,” not just a “what.” A table of raw season totals is just a spreadsheet on a slide. But a chart comparing your team’s turnover margin before and after a major lineup change? That’s a story about cause and effect.

Curating your data isn’t about having less information. It’s about giving the right information more impact. Choose data with narrative power, visualize it with purpose, and watch your presentations move from being merely informative to genuinely influential.

Tools and Templates for Creating Infographics

Let’s face it: your real value isn’t in design skills. It’s in your analysis. Today, tools have caught up with this reality. We’re in a golden age of DIY design, where platforms help you focus on strategy, not details.

Services like Venngage, Kapwing, and Infogram are your digital coaches. They’ve mapped out the game plan for you. Venngage offers templates that bring sports to life. Kapwing makes it easy to create pro-quality designs without a degree. Infogram has a vast library for sports topics, from reports to slides.

Your task is simple: add your data and adjust colors. These platforms understand the difference between a hockey player’s chart and a yoga report. They provide structures for sports analytics templates so you can create quickly.

The real magic is in the details. It’s not just about static images. It’s about dynamic elements, interactive charts, and animations that make data pop. The barrier to entry is knowing where to find the right tool. The right tool turns stats into a compelling story.

Forget about being a design expert. Your new role is curation and customization. With these platforms, you can focus on crafting the winning story. The complicated design era is over. Now, it’s about picking the right template.

Real Examples from Team Meetings

Theory is fine, but the film room doesn’t lie. Here’s how sports data visualization changed our team meetings. They went from boring to exciting.

We made data the main attraction. Let’s look at three infographics that made a big difference.

A dynamic sports data visualization scene in a modern conference room. In the foreground, a large screen displays vibrant graphs and charts illustrating team performance metrics, with colors like blue, green, and orange to represent different data sets. In the middle, a professional team of diverse individuals in business attire are actively engaged, analyzing the data with expressions of focus and discussion. In the background, large windows reveal a view of a stadium filled with fans, enhancing the energizing atmosphere. Soft, natural light streams in, creating a bright and motivating environment. The composition is captured with a slight tilt, emphasizing the lively interaction and importance of data-driven decision-making in sports.

Our mid-season review for the star striker was eye-opening. We used a dynamic radial chart. It showed his goals, assists, and successful dribbles with animation.

Next to it, a video clip played perfectly. It showed the exact goal when his stats spiked. The connection was instant. Everyone felt the excitement.

This wasn’t just about numbers. It showed cause and effect. The coaches felt the play, not just saw the stats.

The Individual Sport Story

For our marathon recap, we used a different approach. The final time was in big, bold font. It was the main focus.

On either side, we used icons and maps. A sneaker for the shoe, a cloud for the weather, and a map for the course. It told a story of endurance and strategy.

It answered the “how” and “why” behind the time. It was much more engaging than a report.

The Front-Office Geographic Intel

This one was for the big-picture thinkers. We layered a map over a bar chart of talent output.

Clicking on a region, like South America, showed more stats. It turned a static map into a treasure map.

This sports data visualization gave immediate insights. The front office loved it.

Infographic Type Core Visual Element Key Interactive Feature Best For Meeting Impact
Athlete Performance Animated Radial Chart Synced Video Highlights Player Reviews & Development Creates direct link between data and on-field action
Individual Sport Icon-Driven Story Layout Centralized Key Metric (e.g., Time) Event Recaps & Solo Athlete Analysis Transforms a result into a narrative of conditions and effort
Country/Region Performance Layered Interactive Map Click-to-Reveal Deep Data Scouting & Strategic Planning Enables discovery of macro trends and micro opportunities

These aren’t just designs. They are real tools. They made our team meetings more engaging.

The key is each example centralizes one killer insight. It uses visuals to make data hard to ignore. That’s the power of visual storytelling with stats.

How to Integrate Infographics Into Your Slide Deck

You’ve made a great infographic, but putting it all on one slide is a big mistake. It’s like a game where you win or lose based on how you use your infographic. Think of it as a motherlode of visual assets waiting to be used.

Breaking it down into smaller parts is key. Each part should support your story at the right time. This way, your infographic slides become the main visual language of your talk.

  • The headline chart that summarizes your entire argument.
  • Two or three standout statistics that would pop on their own.
  • A progression graph that tells a story over time.
  • A clean, branded color palette and icon set.

Use your infographic pieces wisely in your deck. Make your title slide pop with a big headline chart. Then, highlight a key statistic on its own slide. Use big font and lots of space for a dramatic effect.

For showing improvement, use two slides. The first slide shows the start. The second shows the progress. It builds suspense and focuses on the trend.

For a cool trick, use tools like Infogram or Datawrapper for interactive charts. Add that link to your slides. During Q&A, let your team explore the data live.

Tactic Best For Execution Tip
Asset Mining All presentation types Break your infographic into 4-5 core visual components before opening your slide software.
Full-Bleed Background Title, section divider slides Use a key chart with high contrast; ensure title text is clearly legible over it.
Stat Isolation Emphasizing a single, powerful data point Use a font size that is shockingly large. Less is definitively more.
Animated Graph Build Showing progression, growth, or cause-and-effect Use simple “Appear” or “Wipe” animations. Avoid distracting spin or bounce effects.
Embedded Interactivity Executive briefings, technical deep-dives Test the live link on the presentation machine beforehand. Have a static screenshot as a backup.

Your infographic should be a key part of your presentation, not just a guest. It should match your presentation’s style, making everything look professional. When done right, your audience will see one story, not just a bunch of slides and an infographic.

Common Mistakes

Let’s take a break and look at common mistakes in sports infographics. Even with great data and a cool template, mistakes can make your audience lose interest. It’s not just about showing numbers; it’s about making a clear point.

First, there’s the “Kitchen Sink” Fallacy. This is when you try to include every metric on one slide. It ends up being too much information. Your audience wants clarity, not a data overload. Focus on one key message.

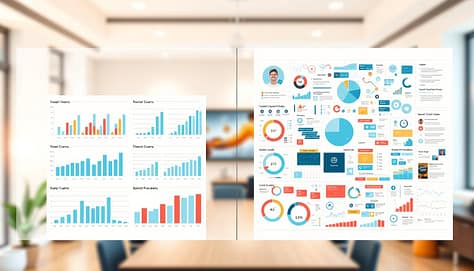
A split-screen image illustrating the differences between clean and cluttered presentation charts. On the left, a clean chart design showcases clear, concise data visualizations, with ample white space, using a light color palette to enhance readability. It includes well-structured graphs and icons representing sports data, such as player statistics and game analytics, all harmoniously arranged. On the right, a cluttered chart displays overwhelming information with busy backgrounds, chaotic graphics, and inconsistent color schemes, making it difficult to interpret. The background features a softly blurred modern office environment with warm lighting to create a professional yet inviting atmosphere. Use a slight overhead angle to capture both sections evenly, emphasizing the contrast between effective and ineffective data presentation styles.

Next, we have Chartjunk. Think of those old PowerPoint slides with too much going on. They’re not just outdated; they’re misleading. Keep your infographic simple and let the data speak for itself.

Then, there’s Legend Laziness. Using too many colors can confuse your viewers. Make sure your colors are clear and easy to understand. Use icons to simplify your message.

The worst mistake is Narrative Abandonment. You create a great chart, but it doesn’t fit with your story. Each visual should support your argument. Make sure your presentation charts are part of a cohesive story.

To avoid these mistakes, be intentional with your design. Every element should have a purpose. When you focus on what’s important, your visuals will be clear and impactful. This is how you make a lasting impression.

Resource List

Think of this as your guide to the best tools for turning stats into stories. You don’t need to know them all. But knowing what’s out there can make a big difference. It’s like having a game plan for your sports analytics slides.

Here’s your starting lineup of design platforms, each with a unique role.

  • For Template Variety & Sports-Specific Design: Venngage. Their library is like a sports analyst’s dream. It has everything from play diagrams to season recaps, making your slides pop.
  • For Speed, Simplicity & Branding Control: Kapwing. It’s super easy to use. Need a sharp infographic fast? Kapwing is your go-to for quick, polished sports analytics slides.
  • For Interactive & Dynamic Data Storytelling: Infogram. This is for when you want to take your data to the next level. It lets you add live charts and animations, making complex stats easy to follow. Check out these 3 sports infographic templates to get started.

Bonus Pro Tip: The tools are only as good as the data you use. Don’t forget to tap into sources like Sports Reference and official league APIs. Pair these with the right design tools, and you’ve got a top-notch sports analytics slides pipeline.

Choosing the right tool is key. It doesn’t just make your job easier. It makes your final product smarter.

Conclusion

So, you’ve got the stats. Now, do you have the story? We started with a common problem: a slide deck full of numbers and an audience losing interest. We’ve shown you how to solve this.

Using infographics for sports presentations is your key strategy. It turns numbers into a story everyone can see. This isn’t just for looks. It’s a major way to share complex ideas.

Think of sports data visualization as your top assistant coach. A good infographic slide can explain a season’s trends better than many bullet points. It makes your charts clear and memorable.

You’re not just reporting data. You’re the analyst who connects the dots. Your sports analytics slides should make complex ideas simple. Tools like Canva and Venngage help you in this visual journey.

The boring decks era is over. Your next presentation is a chance to make a big impact. Will you just share info, or create a memorable moment? Your data is ready for its big moment. Give it the visual stage it deserves.

Deliver Like a Pro: Presentation Skills for Coaches and Managers

Imagine stepping up to speak and feeling completely in control. This isn’t just about talent—it’s about preparation. The work you do before facing your team or clients is key.

Think of this as your pre-game ritual. It starts with a clear purpose. What’s the one thing you want your audience to remember? Time-boxing your prep makes you focus and efficient right away.

The biggest shift is moving from a performance mindset to one of service. Ask yourself: “What does my audience need to hear?” This simple question, as explored in resources on effective presentation techniques, boosts genuine engagement.

Next, we move beyond just flipping through slides. Structured practice, like rehearsing in the actual setting, helps you internalize your material. Remember, good sleep, diet, and exercise build your mental strength against anxiety.

Master these steps, and you’ll unlock the ability to deliver with authentic confidence. You’ll have a natural, compelling speaking cadence from your first word.

Open Strong: story, stat, or clip; frame the “why now”

Imagine starting your next team meeting with a story so gripping that everyone leans in, eager to hear more. That’s the power of a strong opening. Your first minute sets the entire tone. It decides whether your team is with you or mentally checking their phones.

We have three powerful tools to make that first minute count: a compelling story, a surprising statistic, or a short video clip. Your choice depends on your message and your audience. Let’s break down how each one works to boost your presentation skills for coaches.

Stories connect on a human level. They build emotion and make your message unforgettable. Think of Richard Turere, the young Kenyan inventor. He told a simple story about protecting his family’s cattle from lions using flashing lights made from scrap parts—his “lion lights.”

That story isn’t just about innovation. It’s about resourcefulness and solving a real problem. When you share a personal or relevant story, you’re not just giving information. You’re building a bridge of shared experience with your team.

The Statistic That Sticks

Numbers have power, but raw data often feels distant. Your job is to make it relatable. Source 2 highlights a great tactic: translation. Instead of saying “a billion kilowatt-hours,” frame it as “the energy needed to power every home in our city for a month.”

This turns an abstract figure into something your audience can see and feel. A well-framed statistic creates a “wow” moment. It makes your team lean in and think, “I didn’t know that. Tell me more.”

The Tone-Setting Clip

A short, well-chosen video clip (under 60 seconds!) can instantly establish mood and context. It’s visual and visceral. Maybe it’s a clip of a thrilling sports comeback to talk about resilience. Or a quiet moment of customer feedback to highlight service.

The clip does the heavy lifting of setting the emotional stage. Then, you step in to connect it directly to your team’s world. This tool is fantastic for visual learners and creates a shared reference point instantly.

Framing the “Why Now”

Here’s the secret sauce. After your story, stat, or clip, you must immediately answer the question burning in your team’s mind: “Why are we talking about this today?” This is your “why now.”

Connect your opener directly to a current challenge, a new opportunity, or a shared goal. For example: “I shared Richard’s story because, like him, we need inventive solutions this quarter to hit our targets.” This creates instant relevance. It transforms your opener from interesting to urgent.

Mastering this combination—a powerful hook followed by clear relevance—is what drives deep engagement. It shows your team that this isn’t just another talk. It’s a conversation that matters to their work, right now. Start strong, and you’ve already won half the battle for their attention and commitment.

Voice & Body: pace, pause, presence; point with purpose

Keeping an audience’s attention is not just about what you say. It’s also about how you say it and move. Your voice and body are key to making your message memorable. They are the delivery system for your ideas.

Your voice should never be a monotone drone. Instead, play with your speaking cadence. Speed up to add excitement or show urgency. Slow down to highlight a key point. This keeps your audience engaged and shows what’s most important.

Don’t overlook the power of a pause. A well-timed silence lets your audience process complex ideas. It also builds anticipation for what’s next. It’s a simple yet effective presentation skill for coaches to master.

A dynamic scene of a professional coach, a middle-aged woman in a smart blazer and pants, passionately presenting to an engaged audience. She stands confidently at the forefront, using purposeful gestures to emphasize key points, her hands open and expressive. Her facial expression reflects enthusiasm and charisma as she varies her vocal tone, captivating her listeners. In the middle ground, a diverse group of attentive participants in business attire, nodding and taking notes, is positioned to create a sense of engagement and interaction. The background features a modern conference room setting with soft, diffused lighting to create a warm atmosphere. Capture the coach from a slightly low angle to enhance her presence, highlighting the importance of effective communication in a leadership context. The overall mood should be inspiring and empowering, showcasing the essence of impactful presentations.

Your physical presence is also key. Stand confidently with your feet shoulder-width apart. This shows you own the space. Your gestures should be meaningful, not random. Point at slides when referencing them and use open palms to suggest ideas.

Here’s a pro tip: record your talks while practicing. This lets you focus on your movement and message. It helps turn nervous movements into powerful nonverbal cues.

To improve, try these drills:

  • Pace & Pause: Read a paragraph aloud. Speed up for lists, slow down for conclusions, and pause after key statements.
  • Gesture with Purpose: Practice your main points in front of a mirror. Use one clear gesture for each big idea.
  • Emotive Words: Highlight emotional words in your script (e.g., “breakthrough,” “critical,” “exciting”). Give them extra emphasis when speaking!

Mastering your voice, pauses, and body takes self-awareness and practice. When they work together, you create an experience, not just share information. This is the mark of advanced presentation skills for coaches and leaders.

Manage the Room: seating, sight lines, devices away policy

Think of your presentation room as a stage. Every chair, sight line, and phone is something you can control. This is your domain. Mastering this environment is key to your presentation skills for coaches. It turns you from a speaker to a true facilitator of learning.

Your first move is intentional seating. Don’t leave it to chance! Arrange chairs to match your goal. For discussion, try a U-shape or rounds. For focused attention, use theater-style rows. The right setup silently encourages the interaction you want.

Next, master the sight lines. Before your audience arrives, sit in every seat. Can they see you, the screen, and any flipcharts clearly? Remove visual obstructions like pillars or plants. This is audience-centric design in action—creating a “slide” in the physical space that everyone can read.

Now, let’s talk about the elephant in the room: devices. Laptops and phones are massive distractions. Setting a respectful “devices away” policy isn’t about being strict. It’s an act of empathy. You’re protecting your audience’s focus and the group’s collective engagement.

How do you set this policy? Be clear and positive from the start. You might say, “To help us all be fully present today, let’s close our laptops and put phones on silent.” Explain the why—it leads to better retention for everyone.

Here’s a pro tip from the field: practice in the actual room if you can. Walking the space builds comfort and aids your memory. You’ll spot issues—like a glare on the screen or a noisy AC vent—that you’d never notice in your office.

Effective room control is proactive, not reactive. You are designing the container for your content. When the physical space is optimized, the psychological space for learning opens wide. Your audience feels considered and ready to connect.

By commanding these elements—seating, sight, and screens—you demonstrate advanced presentation skills for coaches. You create an environment where your message isn’t just heard, but felt and remembered. That’s the ultimate win for engagement.

Interaction: checks for understanding, rapid polls, “teach back” moments

To connect with your team, you need to be interactive. The best sessions are like workshops, not lectures. This is key for presentation skills for coaches.

Your presentation should be a two-way street. Your audience is not just listening; they’re helping build understanding. This makes them more engaged and interested.

A dynamic and engaging scene showcasing various presentation engagement techniques in a modern conference room. In the foreground, a diverse group of professionals in business attire are actively participating in a presentation, with one person leading and using a digital presentation tool. The middle ground features a large projection screen displaying colorful infographics and charts related to audience interaction concepts, such as checks for understanding and rapid polls. In the background, large windows let in soft natural light, creating a bright and inviting atmosphere. The camera angle is slightly elevated, capturing the energy of the participants as they engage in meaningful discussions and “teach back” moments. The overall mood is collaborative and professional, emphasizing the importance of interaction in effective presentations.

Three simple techniques can make a big difference: checks for understanding, rapid polls, and “teach back” moments. Each helps turn listeners into active participants.

Start with simple checks for understanding. Ask questions that make sure everyone gets it. For example, “How would you explain this to a new team member?” This helps catch any confusion early.

Then, use rapid polls to see what everyone thinks. A simple show of hands can be very effective. Ask questions like “How many have faced this challenge?” to get everyone involved.

Here’s a quick guide to using questions for maximum engagement:

  • Rhetorical Questions: Build intrigue and set up your next point. (“What’s the one thing that always derails a project timeline?”)
  • Polling Questions: Make the audience part of your data. Model the desired response first. (“By a show of hands, who agrees that clear communication is our top priority? Let’s see… great!”)
  • “What If?” Questions: Ground abstract concepts in tangible, timely scenarios. (“What if we applied this feedback model to your last client review?”)

The “teach back” moment is very powerful. Ask someone to explain a concept to the group. This confirms understanding and empowers the participant.

Using these interactive techniques keeps your talk engaging. It makes the transition to Q&A smooth and productive. You’re not starting a conversation; you’re continuing one you began well.

Handle Q&A: bridge, park, redirect; keep clock discipline

Mastering the Q&A isn’t about knowing all the answers. It’s about guiding the conversation to support your main points. This part can be unpredictable, but with the right Q&A tactics, you turn it into your most engaging tool.

Imagine yourself as a conversational traffic cop. Your task is to keep the discussion flowing, relevant, and on time. We use a simple three-part framework: Bridge, Park, and Redirect.

  • Bridge: When a question goes off-topic, don’t just answer it. Bridge it back to your main message. Say something like, “That’s an interesting point about X, which actually connects to our main theme of Y because…” This keeps you in control of the narrative.
  • Park: Some questions are complex or require a deep dive you don’t have time for. Instead of dismissing them, respectfully park them. “That’s an excellent question for a longer discussion. Let me jot it down and I’ll follow up with you after the session.” This shows you value the input without derailing the clock.
  • Redirect: You don’t have to be the sole source of wisdom. If someone else in the room has expertise, redirect the question. “You know, Sarah on your team has done great work in that area. Sarah, what’s been your experience?” This harnesses collective knowledge and builds community.

All these Q&A tactics rely on one non-negotiable: clock discipline. Decide in advance how long you’ll dedicate to questions. Announce it: “We have about 10 minutes for Q&A so we can end on time.” Keep a discreet eye on the clock. When time is nearly up, take one last question. This proactive time management is a cornerstone of professional room control.

What if you blank or get a truly tough question? Here’s where a graceful recovery is key. Don’t be too hard on yourself—it happens to everyone. Use your presentation’s structure as a map to find your way back. You can say, “Let me circle back to the framework we discussed earlier…” This demonstrates poise and turns a potentially stumbling moment into a display of composure.

By bridging, parking, and redirecting with clock awareness, you maintain authoritative room control until the very end. You close the session powerfully, leaving your audience with clarity and respect for your leadership. This final piece solidifies your professional presentation skills for coaches, ensuring you deliver a complete, confident experience.

Record and Review: self‑scout with rubric

Your journey to masterful presentation skills for coaches doesn’t end when you leave the room. The best communicators, like top athletes, study their game tape. Make it a habit to record your sessions, whether audio or video.

Research shows structured review boosts memory retention by up to 40%. Create a simple rubric for your self-scout. Focus on key areas: Was your speaking cadence engaging? Did it vary to emphasize points? Did your nonverbal cues—your posture, gestures, and eye contact—match your message?

Watch the recording with a kind but critical eye. Note what worked brilliantly. Identify one specific area to refine before your next talk. This turns practice into deliberate improvement.

Building this cycle of record and review ensures every presentation you deliver is stronger than the last. You become your own best teacher, continuously elevating your ability to inform and inspire your team.

Microlearning Visuals: One-Page Drill Cards and Cue Sheets

Does your practice plan ever feel like a marathon? You spend hours designing sessions, but players forget the instructions quickly. We’ve all been there.

There’s a better way. Imagine giving a quick coaching tip instead of a huge playbook. Breaking things down into small bits is powerful.

This method is called microlearning. It uses short, strong visuals to help knowledge stick. A one-page drill card or cue sheet is perfect. It quickly shares a single topic and supports learning in the workflow.

Why does it work so well? Short reps lead to fast recall. In a busy rotation of practice stations, athletes can quickly access the info they need. This cuts down on long lectures and keeps everyone focused.

Your goal is to improve players as much as possible in the time you have. These focused tools make complex skills easy to follow. Let’s see how simple drill cards can make your practice stations clear and organized.

Card Anatomy: goal, setup, 3 cues, progressions, common errors

Every effective drill card is built on five key pillars that guide athlete performance. Think of it as a blueprint. We’ll walk through each component together, transforming what might seem complex into simple, actionable steps.

Let’s start with the Goal. This is your card’s North Star. It’s the single, clear objective that keeps every player focused. A good goal is specific and measurable. For example, “Improve lateral agility by completing three shuffle sequences in 10 seconds.” This clarity tells everyone exactly what success looks like.

Next up is the Setup. This is your pre-flight checklist. List the equipment needed—cones, balls, hurdles—and the exact spacing. A precise setup eliminates confusion and wasted time. It ensures athletes can transition smoothly into the drill and start practicing the moment they arrive at the station.

Now, we reach the heart of the card: the 3 Cues. These are the golden nuggets of instruction. Powerful coaching cues are short, sticky prompts that instantly improve technique. Your job is to pick the most impactful ones. We typically pull from three types:

  • Visual: “See the target.” Show a picture or use a cone as a focal point.
  • Verbal: “Push the ground away.” This is a classic coaching cue for explosive jumps.
  • Kinesthetic: “Feel your weight in your heels.” This connects the mind to body sensation.

Choose one cue from each category for a balanced approach. This multi-sensory method helps the instruction stick in an athlete’s mind long after practice ends.

After the cues, we design Progressions. This is how you scale the drill up. Start simple to build confidence, then add layers of difficulty. A progression for a passing drill might look like this: 1) Stationary passing to a wall. 2) Passing while moving slowly. 3) Passing under defensive pressure. Each step builds on the last, using the same core coaching cues.

Lastly, we include Common Errors. Frame these not as mistakes, but as learning opportunities. By listing what often goes wrong, you help athletes self-correct. For a squat cue like “Keep your chest up,” a common error is leaning too far forward. The card can simply state: “Watch for: Forward lean.” This turns a frustration into a quick fix.

When you combine these five parts—Goal, Setup, 3 Cues, Progressions, Common Errors—you create a powerful, self-contained learning tool. You’re not just writing instructions; you’re building a pathway for immediate improvement. Let’s put this anatomy into practice.

Format: laminate + QR to 30‑sec clip; color code by skill

Creating a lasting microlearning system is all about how you build it. A great drill on a flimsy piece of paper is lost. So, we focus on three key areas: making it last, connecting it digitally, and making it easy to spot.

First, let’s talk about keeping it safe. Laminating your one-page cards is a must. It’s like putting a protective shield around your ideas. These laminated sheets can withstand rain, dirt, and many handoffs. It turns a disposable handout into a valuable tool for your program.

Next, we make the card interactive. Add a QR code in the corner. When scanned, it plays a 30-second video of the drill. This turns static text into dynamic learning. These QR videos are perfect for visual learners and are always there when needed.

A microlearning drill card prominently displayed in the foreground, showcasing a sleek, laminated design with a vibrant color-coded layout, expertly organized by skill levels. The card features a prominent QR code, inviting interaction, and is surrounded by small, colorful icons representing various skills. In the middle ground, a soft-focus workspace with a blurred laptop and stationery hints at a learner's environment. The background features a warm, softly lit office or study, creating a productive and motivating atmosphere. The image is captured with a shallow depth of field, emphasizing the drill card while providing a cozy, inviting mood. The lighting is bright yet soft, enhancing the card's colors without harsh shadows, and the angle is slightly tilted to create a dynamic perspective.

Lastly, we use color coding for quick organization. Use blue for passing, red for shooting, and green for defense. This lets coaches and players quickly find what they need, even in a busy gym.

Together, these three elements make a professional tool for athletes. The table below shows how this format is better than the old way.

Feature Old Method (Paper Handout) New Method (Formatted Micro Card)
Durability Gets wet, tears easily, single-use. Waterproof, wipeable, lasts for seasons.
Video Demo Access Coach must stop to demonstrate repeatedly. Player scans QR code for an on-demand 30-second clip.
Skill Identification Relies on reading small text headings. Instant recognition via color-coded borders.
Long-Term Value Cost of re-printing and distributing. One-time laminate cost; digital video is free to update.

This method is a big step up in essential visual aids for coaching. It moves from passive handouts to interactive tools. Now, your drills are ready to be used in a smooth station flow.

Station Flow: coach scan, player demo, rotate, self-check

When your laminated cue sheets meet a smooth station rotation, magic happens. It’s not just about handing out cards. It’s a four-step flow that turns your tools into a powerhouse of focused practice.

This flow is like a recipe for a productive session. Each step has a clear purpose, keeping everyone engaged and moving forward. Let’s explore each phase of this efficient practice stations flow.

The first step is the Coach Scan. Before starting, you take 30 seconds to visually check each station. Look at the athletes holding their cards. Are they reading it? Do they seem confused or confident?

This isn’t a teaching moment. It’s a quick check to catch any major misunderstandings. A simple question like “What’s the first cue on your card?” can clear things up. Now you’re ready to start!

Next, it’s time for the Player Demo. Instead of explaining the drill again, choose an athlete to demonstrate it. Give them the card and ask them to explain the goal, setup, and three key cues to the group.

This does two great things. It reinforces the player’s understanding and makes the instructions more relatable. The card becomes a script for leadership, not just a piece of laminate.

With clear instructions, the Rotate phase begins. This is where the focused reps happen. Because the instructions are clear, athletes can dive right into the work.

Set a timer for 4-6 minutes per station. Players aren’t waiting for you to explain things again. They’re getting high-quality, intentional repetitions. This is how you build muscle memory fast!

The final step is the Self-Check. In the last 30 seconds, ask players to pause. Have them look back at the “Common Errors” section on their card.

Ask them if they’re doing any of these. This moment of reflection fosters independence. It teaches athletes to assess their own performance against a clear standard. They start coaching themselves!

Flow Phase Primary Purpose Ideal Duration Key Action
Coach Scan Ensure initial understanding; prevent early errors. 30 seconds Visual check & a clarifying question.
Player Demo Reinforce learning through peer teaching. 60-90 seconds An athlete explains the drill using the card.
Rotate Maximize focused, high-quality repetitions. 4-6 minutes Players execute the drill using visual cues.
Self-Check Develop player independence and self-assessment. 30 seconds Players compare their performance to the “Common Errors” list.

When you link these four phases together, you create a dynamic practice environment. The coach becomes a facilitator, not just a lecturer. Players become active owners of their learning.

This structured flow for your practice stations cuts down on dead time and boosts engagement. You get more done in less time, and your athletes build skills—and confidence—with every rotation.

Update Cycle: retire weak drills, add seasonal emphasis

Let’s tackle the dusty binder problem head-on by transforming your card collection into a dynamic, “living library.” A static set of drills can be a silent enemy to coaches. It promises consistency but often leads to stagnation. Your microlearning system needs to evolve intentionally.

It’s important to regularly review your drills, maybe every month or at the end of a season. Your goal is to retire weak drills that don’t challenge your athletes anymore. Look for drills that teams go through easily or where common errors keep happening.

A visual representation of the "microlearning card update cycle." In the foreground, showcase a dynamic, rotating microlearning card with visuals of drills and cue sheets being updated and modified. Use bright colors to highlight the new seasonal emphasis elements being added, such as leaves or snowflakes. In the middle ground, depict a circular flowchart illustrating the phases of retirement for weak drills and the introduction of fresh content. The background should feature a clean, modern office environment with soft, natural lighting, conveying an atmosphere of productivity and innovation. Capture the scene from a slightly elevated angle, making the cards and flowchart the focal points. The overall mood should be engaging and inspiring, echoing the transformative nature of microlearning.

Retiring a card isn’t a failure; it’s a sign of growth. It makes room for new, more effective drills that match your team’s skills. This way, you become a thoughtful designer of practice, not just a presenter.

The next step is seasonal emphasis. Just like a gardener plants different crops each season, you should update your drill library. In pre-season, focus on foundational technique cards. As playoffs near, highlight defensive footwork and high-pressure drills.

This approach keeps training fresh and focused on immediate goals. It tells players what’s most important right now. It turns routine planning into a strategic move.

Think of your card box as a seasonal playlist. You wouldn’t play the same songs all year! By regularly updating your library, every practice minute is invested, not just spent. Your coaching toolkit stays as agile and responsive as your team needs to be.

Library Build: 20 starter cards and storage system

Starting your drill card library is easy. Begin with 20 cards for a solid base. This number is manageable and foundational.

Choose 20 starter cards that focus on key skills. For basketball, include a chest pass, triple-threat stance, and layup. Soccer players should practice first touch, short passing, and defense.

Here are some ideas to get you started:

  • Ball Handling: Stationary dribbling, crossover moves.
  • Shooting Form: BEEF method (Balance, Eyes, Elbow, Follow-through).
  • Defensive Basics: Slide steps, close-out technique.
  • Team Concepts: Simple give-and-go, spacing.

Don’t make all 20 at once. Start with five, then add five more each week. This approach makes it easier and less overwhelming.

Now, let’s talk about where to keep your cards. You don’t need an expensive system. Just start organized. The simplest solution is often the best.

Use a portable file box or a sturdy binder. Tab dividers help organize your drill cards by skill or color. This makes finding cards quick during practice.

A small file box is great for the court or field. A binder is better for clipboard use. The goal is to have everything in one place. No more searching through notes or papers!

Starting with 20 cards and a simple storage system is key. It’s the foundation of your coaching toolkit. You’ll see how this small effort improves your sessions.

So, grab that binder or box today. Begin with your first card. You’re on your way!

Metrics: setup time down, rep count up, error rate down

The true strength of your microlearning visuals is in the numbers. By tracking a few key metrics, you’ll see your drill cards and cue sheets are effective. You’ll move from hoping your practice works to knowing it does.

First, watch your setup time decrease. Players learn to read the card’s goal and steps quickly. This means you spend more time teaching and less on explaining drills.

Next, you’ll notice the rep count increase. Faster station rotations and clear cues lead to more practice. This results in more touches, passes, and shots in the same time.

The most important metric is a lower error rate. When players see a skill broken into three cues, they learn it well. Common mistakes listed on the sheet help them correct themselves. Good technique becomes a habit.

These metrics show a clear path to improvement. Less setup time, more reps, and fewer errors create a cycle of growth. Your coaching becomes more focused. Player confidence grows with each successful try. This system turns your practice plan into a proven engine for improvement.

Editable Practice Plan Templates for Effective Team Meetings

An unplanned team practice is like a movie without a script. It’s full of confusion and yelling. Everyone is just running around.

Wasting field time is not just annoying; it’s a big mistake. The key to a good session is a clear plan.

A customizable template is the magic solution. It’s not just about filling out forms. It’s the strategic blueprint that turns chaos into focus.

Imagine the difference between a jazz performance that soars and one that fails. For the coach, these practice planning templates are key. They give the structure for brilliant moments.

A structured template is only the starting point. To truly maximize impact, coaches must think beyond formatting and focus on delivering engaging sports team meetings that keep players focused, motivated, and aligned around clear objectives.

Why Plan Ahead?

Athletic talent often sticks to what it knows. Without a plan, it doesn’t grow. Planning is key to avoid chaos.

Winging it costs a lot. Imagine two hours on the field without a plan. You spend 50 minutes figuring out what to do. Then, 30 minutes on disorganized transitions. The rest is spent on drills you already know.

On the other hand, a 30-minute session with a practice planning template is much better. You start with a clear goal and a plan. Every minute is used wisely. This approach boosts your results greatly.

Planning isn’t just about saving time. It’s about using your brain better. If you’re busy remembering drills, you miss important details. A template helps you focus on coaching.

Think of planning as preparing your team for success. A good plan helps your team grow and work well together. Without it, your team might struggle. Many teams have shown that planning leads to better results.

Aspect Winging It Using a Practice Planning Template
Time Efficiency High waste, low focus Maximized, purposeful use
Coach’s Mental Load High (Remembering, deciding) Low (Executing, observing)
Player Development Random, comfort-zone focused Targeted, addresses weaknesses
Session Goal Clarity Murky or non-existent Crystal clear from the start
Long-Term ROI Poor, inconsistent results High, compounded improvement

The table shows the difference clearly. Planning makes you a coach, not just a babysitter. The right template turns hope into a solid plan.

Step-by-Step: Using Editable Practice Templates

A great practice is not spontaneous. It’s carefully planned, step by step, using a template as a guide. Forget about just filling in boxes. You’re now the director, and this editable practice template is your script for the next 90 minutes of team development.

Let’s explore the key parts of a top-notch plan. We’re drawing from the world of effective meetings. After all, what is a practice if not the most important meeting your team has all week?

Step 1: The Diagnostic Check-In. This isn’t a therapy session. It’s a quick, tactical check. Look at your team. Are they excited from a win or tired from a test? This 30-second glance sets the tone. You can’t lead an orchestra if you don’t know the mood.

Step 2: Declare the Mission. Vague goals are bad. “Work on defense” is vague. A clear goal is: “By 4:45 PM, our midfield will execute three consecutive counter-press triggers with coordinated verbal calls.” Write this clearly at the top of your sports team practice slide.

Step 3: Sequence the Agenda Like a Pro. Your template becomes a conductor’s score here. The order is set:

warm-ups, skill drills, tactical scenarios, and a short review period. Each section should have a clear time block and purpose so players know exactly what the focus is at every stage of practice.

Great coaches also review and refine their plans the same way writers revise their drafts. Many professionals use tools similar to the best essay editing platforms to polish their communication, making sure instructions are clear, structured, and easy for the team to follow. When your practice plan is well-organized and edited for clarity, every drill runs smoother and every minute of training counts.

  • Announcements (First 5 mins): Only about logistics. Game times, bus schedules, uniform colors. Clear the admin stuff first.
  • The Main Event (The Next 60 mins): This is your main drill. This is the key scene you’re here to film. Every minute counts here.
  • The Parking Lot (Ongoing): Got a player with a great idea? “Park it.” Have a spot for these ideas. It keeps creativity flowing without derailing the plan.
  • Action Items & Next Steps (Final 15 mins): This is often overlooked but critical. What did we just do? What does each person need to remember? Who’s responsible for what next time? This sets up the next scene.

Step 4: Assign Rules & Roles. Who’s leading the water break? Who’s setting up cones for Drill B? Make this clear in the plan. It turns chaos into order and teaches teamwork.

Step 5: Ruthless Time Allocation. Your template’s time column is not a suggestion; it’s a rule. A 15-minute drill that goes over steals from the action-item period. Be strict with time. The best directors always yell “cut!” on schedule.

See the difference? You’re not just planning activities. You’re creating focus, measuring progress, and building accountability. Your editable practice template is your blueprint. These steps help you build a strong foundation and structure.

Best Practices: Sharing Practice Plans With Players

When you send out a practice plan, you turn players into active participants. It’s not just about following rules. It’s about creating a shared vision before practice even starts.

Being transparent is a game-changer. It moves you from being a teacher to a team leader. Players start thinking ahead, asking how they can improve for the next drill.

Your editable coach resources become a public statement. It’s like a promise to the team. It says, “I’ve thought it through. Now it’s your turn to contribute.”

So, how do you share this vision? Let’s look at common methods, their benefits, and drawbacks.

Method Pros Cons Best For
The Emailed PDF Classic, official, easy to attach to calendar invites. Everyone has email. Prone to the abyss of the unread inbox. Static. Requires a separate app to view. Formal programs or communicating with parents. A foundational editable coach resource.
The Shareable Link Modern, interactive. Lives in the cloud (Google Docs, Notion). Updates in real-time. Requires internet and a tiny bit of tech-savviness. Can be overwhelming if over-designed. Tech-comfortable teams. Perfect for collaborative tweaks and last-minute changes.
The Whiteboard Photo in Team Chat Surprisingly effective. Ultra-fast. Feels immediate and authentic. Can be blurry. Not editable. Disappears in chat history. Last-minute reminders, casual teams, or supplementing a main digital plan.

A carefully arranged workspace showcasing editable coach resources. In the foreground, a wooden table is filled with colorful printed practice plan templates, featuring charts and diagrams. A laptop displays an open document with digital editing software visible. In the middle, a diverse group of three coaches—two males and one female—are engaged in discussion, wearing professional business attire. They are pointing at the templates, sharing ideas enthusiastically. In the background, a cozy office environment decorated with motivational sports posters and a whiteboard filled with practice plans. Soft natural light filters in through large windows, creating a warm and collaborative atmosphere. The angle captures a slightly above view, emphasizing the interaction among the coaches and the resources they’re sharing.

Adding a simple PDF to your email is a good start. But today, we need more. A shareable link invites discussion. A whiteboard photo shows the process.

Each method sends a different message. The PDF says, “Here are the rules.” The link says, “Here is our living document.” The photo says, “This is what we’re doing right now.” Your choice shows your coaching style.

The goal is to start practice at a higher level. Skip the time spent explaining the plan. Use it for a strategic question instead. “Based on the plan, which drill will challenge you most today?” That’s the power of a shared framework.

Stop hiding your brilliance. Turn your preparation into their preparation. That’s how a simple template becomes a catalyst for team intelligence.

Visualizing Drills and Progress

Athletes learn from pictures and patterns, not just text. Your list of drills is data. But a visual plan is an experience that builds muscle memory.

Think of a football playbook or a basketball set diagram. They’re not just instructions. They’re the guides for team success. They use spatial and visual intelligence.

Switching from a document to a sports team practice slide is key. It’s not just a PowerPoint. It’s a dynamic map that shows how drills connect.

It answers questions like “Where is the focus?” and “What’s the tempo?” at a glance.

  • Diagrams & Icons: Use simple court diagrams and arrows for drills. Use icons for passing, shooting, or conditioning.
  • Embedded Media: Add a 15-second video example in the plan. It shows the drill’s energy and pace.
  • The Progress Tracker: This is the key part. Add a skill matrix to track progress. Note which concepts were mastered.

This tracker is not just for admin. It’s the story of your season. You can see skills improving over time.

So, a list tells you what to buy. But a recipe with photos shows you how to make something amazing. Your practice plan should be like that. It guides, inspires, and shows the path forward.

Template Sources

Finding a good template source is like discovering a trusted map in a sea of tourist traps. The internet is full of options, each claiming to be the ultimate solution for your team. Your task is to find a template that matches your coaching style.

I divide the landscape into three tribes. Each tribe has its own culture, tools, and ideal user.

Template Philosophy Typical Format When It Shines
The Minimalist Clean Google Doc or Word table, simple PDF. You value speed and clarity. You need a basic structure to jot down drills, times, and notes without any fuss.
The Sport-Specific Drill libraries from bodies like USA Basketball or US Soccer. You’re new to a sport or want proven, sport-specific progressions baked into the practice planning templates.
The Hyper-Digital Interactive apps like SessionLab or Notion. You manage multiple teams, love drag-and-drop functionality, and want to feel like you’re piloting a spaceship.

The minimalist approach is classic. It’s a blank canvas with just enough lines to keep you honest. Think of it as the little black dress of practice planning templates—versatile and always appropriate.

Sport-specific sources are like specialty shops. They offer pre-loaded drills and terminology. The value here is in the curated content, not just the structure. You’re borrowing from a collective coaching brain trust.

Then there’s the hyper-digital realm. These platforms are the nutritional supplements of the coaching world. They promise everything: analytics, player tracking, multimedia integration. Tread carefully. The most feature-rich template often becomes a gilded cage.

My advice? Avoid the overly complex ones that promise the moon. They look impressive but often bury the coaching logic under layers of buttons. Seek out editable practice plan templates that are flexible, clean, and put your decision-making front and center.

The sage’s final word? Borrow structure, not content. The best template is merely a skeleton. You are the one who puts your own team’s muscle, heart, and grit onto it. A template from USA Volleyball might give you the rotation drill framework, but only you know which player needs the extra reps on the back-row attack.

How to Adapt Templates for Any Level

Handing a varsity plan to a middle school team can lead to trouble. It’s not about the plan, but how you use it. The key is being flexible and understanding.

A modern workspace featuring a large wooden conference table at the foreground, covered with colorful, editable practice plan templates. The templates should have varied designs, showcasing user-friendly formats for team meetings. In the middle, there are engaged professionals—diverse individuals in professional business attire—collaborating and discussing adaptations for different skill levels, with sticky notes and pens in their hands. The background includes a large window letting in soft, natural light, illuminating the room and creating a vibrant, energetic atmosphere. A whiteboard filled with additional notes and brainstorming ideas enhances the scene, conveying a sense of collaboration and innovation. The overall mood should feel dynamic and focused, capturing the essence of effective teamwork and adaptability.

Your editable coach resource is like software. It needs to be changed, not just filled out. Being adaptable is what makes a good teacher.

To make a plan work for any team, focus on four key areas. Get these wrong, and your plan won’t work. But if you get them right, you can help any team grow.

Core Variable Youth / Novice Focus Elite / Advanced Focus
Time Short, rapid cycles. Attention is currency; spend it in 10-minute blocks. Longer, sustained effort. Build mental and physical endurance for complex tasks.
Complexity One learning objective per drill. Isolate the fundamental skill. Layer objectives. Add decision-making, pressure, or fatigue to mastered skills.
Attention Span Game-like, high-energy progressions. If it feels like a game, it sticks. Analytical, problem-solving segments. The “game” is solving the tactical puzzle.
Fundamental Mastery This is the entire goal. Repetition of correct form is king. This is the assumed baseline. Drills challenge application under duress.

For beginners, you explode with drills. For advanced teams, you condense and expand. Your editable coach resource is the canvas for both.

For a young team, break down a complex drill into simple steps. Start with basic passing, then add movement, and finish with a game-like scenario. This makes learning fun and easy.

For top players, make the basic passing review quick. Then, add a challenging section inspired by a professional development plan template. Create a “15-Minute Tactical Sprint” where players solve problems and design drills.

The template is not just a form to fill. It’s a guide for your teaching. Think about what you want to achieve and how to make it engaging. Your editable coach resource is the clay, and your teaching is the sculptor.

Download & Customize

Think of a template as an off-the-rack suit; your team’s unique needs are the tailor’s measurements. The theory is for cafes. The action is for the field. This section is your practical bridge from concept to clipboard.

Let’s start with your foundation. Below is a link to a “Starter Kit” – a basic, editable sports team practice slide designed to be torn apart and rebuilt. Consider it your raw material.

Your Customization Toolkit: The Edit Points

Opening this file shouldn’t feel like defusing a bomb. It’s more like following a recipe where you’re the chef. Here’s what to tweak:

  • Durations: That 15-minute passing drill? Maybe your squad needs 25. Change it. The template suggests; you command.
  • Drill Modules: Swap them like Lego bricks. Is the conditioning section weak? Replace it with a high-intensity interval block from your playbook.
  • Team Jargon: Insert your lingo. Does your team call a specific play “The Avalanche”? Type it in. This personalization turns generic instructions into team-specific law.
  • The Motivational Core: At the top, insert your quote, principle, or mantra for the day. This isn’t fluff; it’s the psychological pre-game.

The tools for this job are mercifully simple. You have two primary paths, each with its own vibe.

Method Best For Key Action The Vibe
Digital Drag-and-Drop (e.g., Canva, Google Slides) Visual coaches, sharing live with staff/players, embedding videos or diagrams. Click, drag, resize. It’s intuitive and collaborative. The modern architect. Sleek, fast, and built for screens.
The Formatted Word Doc Tactical purists, printing for the clipboard, quick text-heavy edits. Highlight, delete, type. Mastery through simplicity. The seasoned scribe. Direct, no-nonsense, and always ready.
Specialized Sports Software (e.g., Hudl, TeamBuildr) Programs with deep integration, tracking progress over a season. Import template, populate drill library, assign to players. The data scientist. Structured, analytical, and long-term.

Your choice isn’t permanent. Start in Word, then port it to a slide deck for the meeting. The format is fluid; your strategic intent is what solidifies it.

So, hit download on that starter kit. Open it. Immediately change one thing – the title, a color, a time. You’ve just initiated the process. That blank-box intimidation evaporates the moment you insert your first piece of team-specific logic.

This transforms the abstract concept of a sports team practice slide into a living, breathing document on your desktop. It’s no longer a template. It’s your plan. And you can, actually, do this right now.

FAQs

You have questions. I’ve heard them all, from the veteran coach rolling their eyes at ‘paperwork.’ Let’s cut through the cynicism with some sharp, practical logic. This isn’t about bureaucracy; it’s about creating more space for the real work.

Doesn’t a detailed plan kill spontaneity and creativity?

This is the classic objection. The fear is that a template turns you into a robot. But a great plan doesn’t build a cage; it builds guardrails on a winding mountain road. It creates a container for productive spontaneity.

When you know the core drills and timing are set, your brain is freed to observe, tweak, and invent in the moment. The “parking lot” for brilliant, unscripted coaching moments exists precisely because the main highway is clearly mapped. Think of editable coach resources as the scaffolding, not the finished building.

What if we don’t get through everything on the plan?

Then you’ve just conducted a masterclass in prioritization. Seriously. If you end on time and covered the most critical skills, that’s a victory. A template shows you what you consciously chose to skip, which is invaluable data for your next session.

It shifts the mindset from “we failed to finish” to “we succeeded in focusing.” The plan served its purpose: it guided your real-time decisions.

So don’t just “send” it. You’re a coach, not an HR department. Share it differently. Project it on a screen for the first two minutes and walk through it. Use it to frame the “why” of the day.

Make it visual with icons or short videos. The goal isn’t their silent review; it’s shared understanding. These customizable plans are communication tools, not novellas.

I’m not tech-savvy. What if the digital template doesn’t work?

The beauty of modern editable coach resources is their simplicity. We’re talking about clicking and typing in a document, not coding an app. Always have a backup: a printed copy in your bag. The tech is just a vessel for your ideas.

If the file fails, your brain—now trained by planning—won’t.

How do I get buy-in from veteran players who scoff at “paperwork”?

Ah, the seasoned pro who thinks planning is for amateurs. Use humor. “Hey, I know you’ve got this drill in your sleep, but help me bring the rookies up to speed.” Frame the plan as efficiency—respecting their time and energy.

Better yet, involve them in adapting a template. When they see it’s a tool for clarity and not micromanagement, skepticism often turns into advocacy.

The resistance to planning is usually a fear of rigidity. But the right editable coach resources do the opposite. They provide the structure that creates true freedom—freedom to coach, to adapt, and to actually enjoy the session you designed.

Conclusion

What makes a practice session truly effective? It’s not magic. It’s the simple, brutal discipline of planning. An editable practice plan template is your digital drill sergeant.

These templates save you time. They bring order to chaos. They turn players into active learners. You leave the field knowing what was done and what’s next. That’s real satisfaction.

Planning shows respect. It respects your players’ time and your craft. A practice plan template is just a tool. Your coaching wisdom is what makes it valuable.

Now go forth. Plan. Build. Coach with purpose.

Room Tech That Works: AV Setup and Reliability for Team Meetings

The way we work together has changed a lot. We don’t just sit around a table anymore.

Now, we need the right tools for meetings to go well. Good audio-visual equipment lets ideas flow without tech problems.

Hybrid work is here to stay. It means we need tech that connects everyone, in person or online. Everyone should be heard and seen well.

Good tech does more than fix audio and video issues. It builds trust and makes your team more efficient. Clear communication is key to success.

Bad tech can ruin a meeting. That’s why we made this guide. It’s your guide to a space where tech just works.

We’ll make complex tech easy to understand. From checking your room to recording presentations, we’ve got you covered.

Let’s create a space where your team can focus on ideas. Are you ready to start?

Room Audit: seating, sightlines, light control, sound checks

Before we dive into cables and settings, we need to become detectives of our own space. A proper room audit isn’t about complex tools. It’s about using your eyes, ears, and common sense to understand the environment where your technology has to perform. Getting this foundation right makes every single other decision—from display size to microphone choice—simpler and more effective.

The size of your room is your starting point. A small huddle room for 1-4 people needs compact, all-in-one solutions. A large conference room, on the other hand, demands a more strategic setup for video and audio that reaches everyone. Your audit helps you match the gear to the space.

Let’s break down the four key areas you’ll investigate:

  • Seating Arrangement: Where do people actually sit?
  • Sightlines: Can everyone see the screen comfortably?
  • Light Control: Does glare or darkness ruin the view?
  • Sound Checks: How does speech and sound behave in the room?

Start with seating and sightlines. Walk to the chair farthest from the screen. Can you read the smallest text on a test slide without squinting? If not, your display might be too small or too far away. Now, sit in a few different spots. Are there columns, plants, or other people blocking the view? Optimizing sightlines often means simply rearranging furniture or adjusting the screen height—it’s a free fix with a huge payoff.

Next, tackle light control. Turn on your main display and observe. Is there a bright window creating a blinding glare on the screen? Do overhead lights wash out the image? This is a common meeting killer. The fix can be as easy as closing blinds, tilting the screen slightly, or turning off specific light banks. Your goal is balanced, comfortable light where faces are visible and content is crisp.

Now, for the truly fun part: the sound check. Your room’s acoustics are key, and basic sound checks are your first line of defense for good audio. First, clap your hands once, sharply. Listen. Do you hear a quick, flat “pop” or a slight ringing “tail” afterwards? That tail is echo (or reverb), and it makes speech sound muddy. This tells you a lot about the room’s basic audio character.

Second, have a conversation. One person stands near the display, another sits at the far end. Talk at a normal meeting volume. Can you hear each other clearly? Hard surfaces like glass, whiteboards, and bare tables bounce sound around, causing echo and making distant speech hard to understand. Optimizing room acoustics with soft materials—carpets, curtains, or acoustic panels—can dramatically reduce this problem. For larger spaces, achieving clear room-wide audio coverage is a must.

By spending this time on your room audit, you’re not just checking boxes. You’re learning the personality of your space. You’ll know its quirks and strengths, which allows you to choose technology that complements it. This proactive step is the hallmark of a reliable, professional-grade meeting environment.

Display Choices: projector vs TV wall; lumens and size guide

Choosing the right display for your meeting room is like picking the centerpiece for a stage. It sets the tone for everything that follows. Your content comes to life here, so let’s choose wisely. We’ll break down the classic debate and give you a clear guide based on your room’s unique needs.

Think of your display as the window into your team’s ideas. For years, the go-to choice was a projector. It’s like a movie theater experience, casting a large image onto a screen. Modern commercial TVs and video walls, on the other hand, offer a different kind of brilliance. They are like ultra-sharp digital canvases built for bright, everyday spaces.

So, which one is right for you? Let’s compare the two main contenders.

Projectors: The Big Picture Specialists

Projectors excel at creating massive images. They are ideal for large auditoriums or rooms you can reliably darken. The key specification here is projector brightness, measured in lumens. More lumens mean a brighter image that can fight ambient light.

For a typical conference room with some windows, aim for at least 3,000 to 4,000 lumens. A completely dark home theater might need less. Remember, a projector needs a screen and careful placement, but it delivers that classic, immersive feel.

TVs and Video Walls: The Clarity Champions

Today’s commercial displays, like new LG UHD signage with BrightSignOS, offer future-proof visuals with stunning brightness and clarity. A large TV or a video wall (multiple screens tiled together) is perfect for well-lit boardrooms and lobbies.

They turn on instantly, have incredible color accuracy, and don’t require a dark room. For a small huddle room, a 55-inch touchscreen might be perfect. A formal boardroom often needs a 75-inch display or larger to ensure everyone has a clear view.

Your Simple Size and Brightness Guide

Your room’s dimensions and lighting decide the winner. Use this simple framework:

  • Small Huddle Room (4-6 people): A 55-inch to 65-inch commercial TV is often ideal. It’s bright enough for lights-on collaboration.
  • Mid-Size Conference Room (8-12 people): Choose a 75-inch to 85-inch display or a projector with 4,000+ lumens if you have light control.
  • Large Boardroom or Auditorium (15+ people): A projector with 5,000+ lumens or a large-format video wall ensures visibility from the back row.

Don’t forget about connections! While we’ll dive deeper into cables later, know that a high-quality HDMI cable is the superstar for carrying a crisp digital signal from your laptop to either a projector or a TV. It’s the reliable standard you can count on.

The goal is to pick a display that feels just right—impressive without being overwhelming. Whether it’s the expansive glow of a projector or the pixel-perfect detail of a video wall, your team’s work deserves to be seen in the best possible light.

Connections: wired priority, casting alternatives, adapters kit

Dealing with cables and wireless options can be overwhelming. This section guides you to perfect connectivity. We’ll cover how to prioritize wired links, find easy casting alternatives, and create a universal adapter kit for any device.

Your connection is like a bridge between your ideas and your audience. A weak bridge causes delays and frustration. A strong one ensures your message flows smoothly.

The Wired First Philosophy

For critical presentations, we recommend a “wired first” approach. A physical HDMI or USB-C cable offers the most reliable, high-quality signal with zero lag. It’s like a dedicated highway for your video and audio.

Wired connections are often preferred for stable, high-quality video calls. They eliminate Wi-Fi congestion or signal interference. Simply plug in and present with confidence.

Your primary setup should always include a high-quality cable directly connected from your main presentation laptop to the display. This is your non-negotiable baseline for reliability.

A professional wireless casting and adapter kit laid out on a sleek conference room table, surrounded by modern tech elements like laptops and projectors. In the foreground, detailed close-ups of various adapters, dongles, and a wireless receiver, highlighting their sleek designs and vibrant colors. In the middle ground, a high-quality projector casting a sharp image onto a large screen, while a stylish laptop displays a presentation seamlessly connecting via wireless technology. The background features glass walls and soft ambient lighting, creating a polished, corporate atmosphere. The image captures a sense of efficiency and innovation, ideal for enhancing team meetings. The scene is well-lit with natural light illuminating the workspace, evoking a mood of professionalism and collaboration.

Embracing Wireless Casting Alternatives

We live in a world where everyone uses different devices. Team members will want to share from tablets, phones, or secondary laptops in seconds. This is where wireless screen casting shines.

Tools like the ClickShare Hub allow participants to share with a single tap, simplifying hybrid meetings. Built-in standards like Miracast (for Windows/Android) and AirPlay (for Apple devices) also offer convenient, cable-free options.

The key is to choose a system that is intuitive for your users. A good wireless system reduces friction and keeps the meeting’s momentum going. It’s perfect for brainstorming sessions or quick reviews.

Feature Wired Connection (HDMI/USB-C) Wireless Casting (ClickShare/AirPlay)
Reliability Excellent – No signal drop Good – Depends on network health
Setup Speed Fast (once plugged in) Very Fast (often one-tap)
Video/Audio Quality Consistent, high-fidelity Very good, but can compress
Best For Keynote speeches, final client presentations Collaborative brainstorming, impromptu shares
Device Compatibility Requires correct port/adapter Works with many modern devices wirelessly

Building Your Universal Adapters Kit

“Prepare for everyone” is our mantra. The moment someone can’t connect is the moment your meeting stalls. Avoid this by assembling a small, powerful adapters kit.

This kit is your connectivity safety net. It should live permanently in your meeting room. Here’s what to include:

  • USB-C to HDMI: The modern essential for most new laptops.
  • USB-A to HDMI: For older laptops and peripherals.
  • Mini DisplayPort to HDMI: Covering specific business laptops.
  • VGA to HDMI (active adapter): The ultimate legacy lifesaver.
  • A multi-port USB-C hub: A powerhouse that adds HDMI, USB-A, and Ethernet.

With this kit, you’re not just supporting technology—you’re supporting people. It empowers every team member to contribute seamlessly, which is one of the key skills every coach needs for leading successful sessions, whether in sports or business.

By mastering both wired and wireless connections and being prepared with adapters, you ensure that your team’s focus stays on the content, not the cable. That’s how you build a truly reliable and inclusive meeting environment.

Audio: mic options, echo control, volume baselines

Ever been on a call where someone sounds like they’re in a tin can? Or you can’t tell who’s speaking? That’s the sound of a meeting breaking down. Perfect audio is the glue that holds a remote collaboration together. Let’s make sure everyone is heard crystal clearly.

Choosing the Right Microphone for Your Space

Your microphone choice depends on your room’s size and layout. For a small huddle room, a simple all-in-one soundbar is often perfect. It combines speakers and mics in one neat package.

In larger spaces, you need smarter technology. Beamforming microphone arrays, like the Yealink CM20, are game-changers. They act like a spotlight for sound, automatically focusing on the person who is talking. This cuts out background noise and makes every word sharp.

For boardrooms where a clean table is a must, ceiling microphones like the Yealink CM50 are ideal. They’re installed overhead, keeping cables and hardware out of sight while picking up voices from all seating positions.

Many modern devices also feature AI-powered noise cancellation. A product like the Yealink DeskVision A24 can distinguish between a human voice and other sounds—keyboard clacks, paper shuffles, air conditioning—and remove the distractions in real-time.

Echo makes conversations exhausting. It happens when sound from the speakers is picked up again by the microphones. The fix is part technology, part placement.

First, follow the one-foot rule: keep microphones at least a foot away from speakers. Second, consider your room’s surfaces. Hard walls, floors, and tables bounce sound around. Adding soft materials like carpets, curtains, or even acoustic panels can absorb those reflections dramatically.

Smart microphone placement is your secret weapon. Point directional mics towards people, not at blank walls or speaker outputs. For more advice on how room dimensions and furniture affect sound, check the official room planning guidance.

Setting a Smart Volume Baseline

You need a standard, comfortable volume level. It should be loud enough for remote participants to hear easily, but not so loud it blasts people in the room or causes distortion.

Here’s a simple way to set it: Have someone sit in the farthest seat from the speakers. Play a standard test tone or a familiar music track at a moderate volume on your conferencing system. Adjust the level until it’s clear and comfortable for that person. That’s your baseline. Mark that setting and try to keep all meetings there.

Remember, great audio is invisible. When it’s done right, no one compliments it—they just have a productive, frustration-free meeting. That’s the goal we’re helping you achieve.

Latency and Sync: clip testing, playback devices, codecs

Latency is that slight delay between audio and video. It can turn a professional presentation into a confusing mess. But, with a few simple checks, you can sync everything up and ensure your hybrid collaboration flows naturally.

Imagine watching a badly dubbed movie. When the words don’t match the mouth movements, your brain works overtime. In a business meeting, this distraction wastes time and reduces clarity. Let’s eliminate that problem together.

A professional workspace featuring a modern AV setup for latency and sync testing. In the foreground, an array of high-tech playback devices, including a laptop and a digital signal processor, prominently displaying waveforms and codec settings on their screens. The middle ground showcases a group of diverse individuals, dressed in smart business attire, engaged in meticulous testing, adjusting devices, and reviewing results. They are surrounded by an array of cables, microphones, and video screens displaying synchronized clips. In the background, a bright, tech-inspired office space with large windows allowing natural light to flood in, enhancing the atmosphere of focused collaboration. The image should evoke a sense of precision and reliability, emphasizing the importance of thorough testing in maintaining AV setup integrity.

Your Simple Clip Test for Perfect Sync

You don’t need expensive gear to check for latency. We recommend a quick “clip test.” Find a short video online with a sharp audio cue—like a hand clap, a drum hit, or a speaker clearly saying “pop.” Play this clip on your meeting room’s primary display through the usual system.

Watch and listen closely. Does the sound happen at the exact moment the visual action occurs? If you see the hands meet before you hear the clap, you have detectable latency. This test gives you a real-world benchmark for your system’s performance.

Playback Devices and Software Settings

Where you play the video from matters. A laptop connected via HDMI might perform differently than wireless casting from a tablet. Test using the same devices your team actually uses for presentations.

Check the audio output settings on your computer and conferencing software. Sometimes, the software selects a different audio device than your room’s sound system, creating a delay. Ensuring everything is routed through one primary system is a key step for sync.

Understanding Codecs: The Behind-the-Scenes Translators

Codecs are the essential software that compress and decompress video and audio signals. They’re like translators for your media. Different codecs (like H.264, VP9, or AV1) handle data at different speeds, which can affect latency.

For video conferencing, systems often use specialized codecs designed for low latency. If you’re experiencing consistent sync issues, check what codec your conferencing platform prefers. A reliable system will prioritize codecs that support seamless, real-time communication.

Modern conference room technology is built to support hybrid collaboration seamlessly. High-quality video conferencing relies on these proper codecs and a well-tuned system. A quick check here prevents the audio drops and visual delays that can derail an entire meeting.

By running this simple clip test and understanding your playback chain, you take control. You ensure your meetings feel natural, professional, and engaging. A little proactive testing saves everyone from a lot of distraction later.

Redundancy: offline copies, spare cables, printed boards

True meeting room mastery is not just about things working. It’s about being ready when they don’t. This is what redundancy is all about. It’s your tech safety net, always ready to keep your meeting smooth.

We’ll show you how to build a simple habit that makes you a tech master. Start with a small “oh-no” kit for your room. It’s not about fancy gear. It’s about simple backups that give you confidence.

  • Offline Copies: Keep a USB drive in the room with your important files. If the network goes down, you’re ready in seconds.
  • Spare Cables: Carry a pouch with must-have cables like HDMI and USB-C. Having spares means you can solve problems quickly.
  • Printed Boards: Have printed copies of agendas and diagrams. It’s old-school, but it helps if screens fail.

This approach matches the key criteria for choosing room tech: reliability. Regular checks and spares prevent small problems from becoming big ones. A well-run room means systems and backups work every time.

Creating this kit is like carrying an umbrella. You might not use it every day, but when you do, you’re really glad. This mindset means you’re always in charge of your meeting’s success. Let’s build that confidence together.

Run of Show: preflight checklist and roles

All your AV gear is set up and tested. Now, it’s time to coordinate the human element. Think of this as your meeting’s “Run of Show”. It’s the backstage work that makes everything run smoothly from start to finish.

This isn’t just about checking boxes. It’s about turning your room into a dynamic space. Here, technology and teamwork come together perfectly.

The Five-Minute Preflight Checklist

Every pilot does a preflight check before flying. Your meeting needs the same attention. We suggest a quick, five-minute check that anyone can do.

Here’s what to check:

  • Lights On: Make sure the room is well-lit for screens and comfort. Check for glare on displays.
  • System Booted: Confirm all AV equipment is on and showing the right input sources.
  • Mics Live: Do a quick sound check. Tap each microphone and listen for clear audio through the speakers.
  • Presentation Loaded: Open the main deck on the presentation computer. Check the first few slides to make sure they display right.
  • Connections Stable: Verify all wired connections are secure. Also, check that any wireless devices are paired and ready.

Tools like YAROOMS help with room booking and scheduling. But this hands-on checklist catches any last-minute issues.

Assign Clear Roles, Even in Small Teams

Who does what during the meeting? Confusion can cause awkward pauses and technical problems. Even with a small team, assigning clear roles helps everything run smoothly.

Consider these key positions:

Role Primary Responsibility Key Action
Presenter Deliver content and guide discussion Focus on engaging the audience, not operating slides
Tech Manager Handle all AV controls and troubleshooting Advance slides, adjust volume, manage shared screens
Chat Monitor Bridge communication with remote attendees Voice questions from the chat and share key points

You don’t need three people for these roles! One person can often handle both tech and chat duties. The key is that everyone knows their role before the meeting starts.

The Power of the Pre-Meeting Huddle

Gather your key players for a two-minute huddle before starting. This is your final sync-up.

Use this time to confirm the agenda order and highlight any special tech needs (like a video clip). Also, remind everyone of their roles. This brief huddle aligns your team’s mindset and answers any last-second questions.

Automating meeting controls, like setting presentation timers or pre-configuring screen layouts, adds to the seamless experience. But the human huddle ensures everyone is ready to adapt if needed.

When you combine a detailed preflight checklist with clear roles, your meeting becomes more than just a discussion. Your AV setup becomes a well-oiled machine, driving your team toward better collaboration and results.

Post‑Meeting: save annotations, version name, upload rules

The meeting ends, but your tech workflow shouldn’t! A proper post-meeting routine locks in the value of your collaboration. This final step turns a great discussion into actionable, lasting results.

First, save all important data. Did your team use a digital whiteboard like Miro or FigJam? Export those annotations. Capture chat logs from Slack or Microsoft Teams. Tools like Microsoft Teams Rooms offer live transcription you can save for reference. This step protects every idea shared.

Next, give your files a clear version name. A simple system like “ProjectAlpha_Review_2025-10-27” works wonders. This file management practice makes it easy for anyone to find the right document later. No more searching through “final_v2_new_reallyfinal” chaos!

Lastly, follow consistent upload rules. Move the saved files to a shared team folder on Google Drive, SharePoint, or your company’s cloud drive. Set a rule that everyone does this right after the meeting. It ensures information is accessible for future reference.

This post-meeting habit builds your team’s institutional memory. Brilliant ideas discussed won’t get lost. By closing the loop, you ensure your reliable AV setup contributes to lasting productivity long after everyone leaves the room.

PowerPoint That Plays Fast: Design Principles for Sports Staff Presentations

Welcome! If you’re on a sports staff—a coach, athletic director, or marketing pro—you know clear communication is key. It can turn a good play into a championship-winning moment. Your presentations should be as sharp and effective as your game plans.

A well-crafted deck is like a perfectly executed playbook. It’s organized, easy to follow, and gets everyone on the same page fast. We’re here to explore the core principles that make slow, cluttered slideshows into dynamic, impactful tools your audience will enjoy.

These methods are used every day. Coaches break down complex strategies, organizations pitch to sponsors, and fitness trainers outline workout plans. Using a professional sports powerpoint template helps present data visually and supercharges your communication.

Let’s dive into the best practices that ensure your message isn’t just seen, but understood and remembered. We’ll guide you through structuring slides for maximum effect, using real-world examples you can apply immediately.

Audience and Context: coaches vs players vs admins

The most important choice for sports presentations isn’t about fonts or colors. It’s knowing your audience. If you get it right, your message hits home like a perfect pass. But if you don’t, you’ll see people zoning out faster than a blown coverage.

There are three main groups you’ll present to: coaches, players, and admins. Each group thinks, learns, and decides differently. Your task is to create a slide hierarchy that fits their way of thinking. This means putting the most important, actionable info right on every slide.

For coaching staff, focus on depth and detail. They love strategy, film analysis, and complex data. Your slides should help spark deep discussions. Think about tactical formations, opponent tendencies, and detailed practice plans.

When talking to players, change your approach completely. Clarity and motivation are key. Use big, bold visuals, short bullet points for drills, and highlight key takeaways. They need to see the “what” and “how” quickly, without getting lost in text.

For administrative staff like athletic directors or school officials, your deck should tell a story with data. Budgets, program growth, and eligibility timelines are the main players. Clean charts and clear summaries help them make quick, informed decisions.

The table below shows how focusing on your audience changes your deck’s content and structure:

Audience Primary Use Case Content Focus Slide Hierarchy Tip
Sports Coaches Strategy Sessions, Training Planning Tactical game plans, film analysis, practice schedules Lead with the core strategic problem; support with film and data.
Athletes / Players Motivation, Skill Installation Actionable drill steps, motivational quotes, clear role definitions Put the key action or takeaway in a large, bold headline at the top.
Athletic Directors / Admins Budget Reviews, Program Reports Financial summaries, participation metrics, compliance updates Start with the executive summary or bottom-line number on each slide.
Sports Marketers & Event Planners Promotion, Logistics Timelines, sponsorship visuals, venue maps, ticket sales data Highlight dates, deadlines, and call-to-actions visually.

See the pattern? By defining your audience first, you naturally create a logical slide hierarchy. You’re not just dumping info; you’re telling a story that resonates. A coach feels ready, a player feels empowered, and an admin feels informed.

This audience-focused approach is what makes other design principles work. Now, let’s build on this foundation and make your deck look the part.

Brand the Deck: colors, logos, master slide setup, export presets

Think of your team’s colors and logo as your presentation’s uniform. This team branding boosts credibility and unity. When your team sees your deck, they know it’s official and trusted.

Start with your Sport Branding Guidelines, if you have them. This guide outlines logo use, colors, and fonts. If not, create a simple guide for your team. Use HEX or RGB codes for colors and decide on logo versions for backgrounds.

Next, create your master slides. This template controls your deck’s design. It saves time and ensures consistency.

A modern, professional PowerPoint master slide setup on a large digital screen in a contemporary office environment. In the foreground, a person in professional attire is adjusting the slide design, showing vibrant colors representing a sports team’s branding. The middle layer features various design elements, including the team's logo, color palette swatches, and placeholders for text and images, all neatly organized. In the background, a sleek conference table and modern office decor set a dynamic, collaborative atmosphere with warm, natural lighting filtering through large windows. The overall mood is focused and energetic, conveying the importance of effective branding in presentations. No text or logos are visible outside the master slide.

In your master slide view, set the background and logo position. Define title and content slide fonts and sizes. This creates a design rulebook for your deck.

Master slides are your single source of truth. They help everyone stay “on brand” without needing design skills. This keeps your team branding consistent, from meetings to reviews.

Don’t stop when designing is done. Prepare your deck for delivery. Export presets are key for different uses.

Save optimized export settings for ten minutes. Use high-resolution PNG or PDF for projectors. For digital use, choose compressed PDF or PowerPoint’s “Create a Video” feature.

By focusing on master slides and export settings, you create a system that works for you. Every message is delivered professionally and unified. It’s a small effort with big impact.

Layout Discipline: grids, white space, rule-of-thirds for film stil

Think of your slide deck as a playing field. Clear lines and markings help athletes play with precision. A disciplined layout does the same for your content, making it shine.

Without it, even the best stats and film clips can feel chaotic. This makes them hard to follow.

The secret to a clean structure is the layout grid. Turn on the invisible guides in your presentation software. Use them to align every text box, image, and data point.

This creates a subtle sense of order. It makes your content instantly easier to digest. A consistent grid signals professionalism and helps your audience focus on the message, not on trying to find it.

Now, let’s talk about what goes between those aligned elements: white space. This is not empty space! It’s a powerful design tool.

White space gives your key messages room to breathe. It reduces visual clutter and cognitive load. This allows the viewer’s eye to naturally rest on what’s important.

A common mistake is trying to fill every pixel. This leads to overcrowded slides that overwhelm your coaches or players. Strategic white space, guided by your grid, provides the clear structure and visual balance your data and film need.

It’s the difference between a calm, focused huddle and a noisy, confusing sideline.

Your layout discipline rests on three core principles:

  • The Grid: Your invisible alignment system for a clean, organized look.
  • White Space: Your strategic breathing room that highlights content and improves readability.
  • The Rule-of-Thirds: Your compositional guide for dynamic visuals, including film stil

Speaking of film, the rule-of-thirds is a game-changer. Imagine dividing a film or photo with two equally spaced horizontal and two vertical lines. The points where these lines intersect are power positions.

Placing a key player, the ball, or a tactical formation on one of these points—instead of dead center—creates a more dynamic and engaging composition. This off-center placement adds visual tension and drama, which helps during film review.

It guides the viewer’s eye through the action more naturally. When you pair this thoughtful composition with a disciplined grid and ample white space, you create a seamless, professional flow. Your smart layout choices work hand-in-hand with clear typography to build presentations that are not just seen, but understood.

Type and Color: 2-font rule, readable sizes, contrast ratios

Let’s explore the power of type and color. Simple rules like the ‘two-font system’ and strict contrast ratios make your data stand out. Think of your presentation’s typography as its voice—it gives your message clarity and confidence. With the right color choices, your slideshow will grab attention from every corner.

The two-font rule is a simple yet effective strategy. Use a clean, bold font for headings like Arial or Helvetica. Then, pick a complementary font for body text, such as Calibri or Georgia. This combo adds interest without causing chaos and is a key to clear communication.

Choosing only two fonts helps avoid distractions. Coaches and players need to process information quickly. Your heading font should shout the main point, while your body font explains the details calmly.

Text size is critical. It must be easy to read in any lighting. Here are some guidelines:

  • Headings: Never go below 36pt.
  • Body text: Stick to 24pt or larger.
  • Critical stats or calls-to-action: Make them bold and consider increasing their size!

If you can’t read it on your laptop, it’s too small for the big screen.

Color contrast is not just about looks; it’s about accessibility and impact. Players with color vision deficiencies and staff in bright rooms need clear instructions. That’s where contrast ratios come in.

A contrast ratio shows the light difference between your text and background. A higher ratio means better readability. Here’s a quick guide to the standards you should aim for:

Contrast Ratio Rating Best Use Case
7:1 or higher Excellent Any text, ideal for high-stakes data and viewers with low vision.
4.5:1 to 6.9:1 Good (Minimum) Normal body text (WCAG AA standard).
3:1 Acceptable Large text (over 24pt or bold 18.5pt).

You can check these ratios for free using online contrast checkers—just plug in your color codes. A classic combo is dark gray text on white or bright white text on dark blue.

A dynamic sports presentation setting showcasing a vivid contrast in typography. In the foreground, a sleek PowerPoint slide displays two distinct fonts demonstrating the 2-font rule, with one bold and modern typeface and another minimalist and elegant. The font sizes are appropriately large and readable, emphasizing clarity. In the middle ground, an illustrative example of contrasting colors highlights effective color choices that enhance readability, such as a bright orange title on a navy blue background. The background features a blurred auditorium filled with engaged audience members dressed in professional business attire, capturing the atmosphere of a lively sports presentation. The lighting is bright and focused on the slide, enhancing the colors and text. Overall, the image conveys a sense of professionalism and energy, perfect for a sports management context.

See how the bold heading stands out? That’s the two-font rule and strong contrast in action. The image shows clear, legible text against a background that doesn’t fight for attention.

Your goal is to make information easy to understand. By sticking to two fonts, large sizes, and checking color contrasts, you create slides that are inclusive and professional. This turns complex info into something everyone can quickly grasp—and that’s a winning strategy.

Visual Components: arrows, highlights, callouts, timers, score bugs

A slide full of random shapes and text boxes is like a chaotic play. It’s hard to know where to look or what to do. You need to guide your audience’s eyes like a play-caller.

Arrows, highlights, and callouts are your silent helpers. They guide attention and highlight what’s important. Using them wisely is key to motion discipline. Even on a static slide, you can lead the viewer’s eyes in a logical path.

  • Arrows: These trace a player’s path, show play flow, or link a statistic to a moment. A well-placed arrow simplifies complex scenes.
  • Highlights & Callouts: They’re like spotlights. Circle a key defender, add a text bubble to a key statistic, or enlarge a frame. They say, “Look here first!”
  • Timers & Score Bugs: These graphics add context instantly. They answer “when” and “what’s the score” questions during game film review, making analysis feel immediate.

The magic is in combining these tools. You decide the order: does the eye see the highlighted player first, then follow the arrow, and then check the clock? This planned sequence is your visual choreography. It’s the practical use of motion discipline on every slide.

Mastering this makes complex sports data engaging. Your presentations become more dynamic, and your message hits hard. That’s the power of giving every visual element a clear, strategic role.

Motion and Media: 10–20 second clips, subtle transitions, compression

Motion and media are like the highlight reel of your presentation. They are short, powerful, and grab your attention. Your slides set the stage, but a good video clip adds emotion and clarity that text can’t.

When using film, choose quality over quantity. Aim for clips between 10 and 20 seconds. This length shows a complete action without losing focus.

Each clip should show one specific concept. For example:

  • A defensive rotation that seals the lane.
  • A perfect shooting form from release to follow-through.
  • A single special teams alignment at the snap.

This focused approach avoids confusion and keeps your message clear. It’s a great way to improve team communication during film reviews or strategy sessions.

Just like a dynamic template for an “Extreme Sport: Skydiving” presentation, your motion elements should add energy. They should not distract from your message.

Transitions should be subtle and consistent. A simple fade is usually best. Avoid flashy transitions. Your goal is to smoothly guide the viewer’s eye, not to impress with special effects.

Compression is also key. A huge, uncompressed video file can slow down your presentation. Nothing is more frustrating than a presentation that freezes.

Always compress your media files before adding them. Most software has tools for this. Smaller files ensure your presentation runs smoothly on any computer.

By setting these rules, you can build them into your deck templates. This makes following best practices automatic.

Standardizing your motion and media approach ensures every presentation is smooth and professional. It makes your content creation process easier, saving you time and technical issues.

When your deck templates are set up for optimal media use, you can focus on finding the perfect clip. This is how you create presentations that are as effective as your game plan.

Data Pages: mini-charts, shot maps, pace bars; avoid clutter heatmaps

A cluttered data slide can lose your audience faster than a fumbled play. In sports, clarity is your MVP. We’ve all seen slides drowning in spreadsheets and tiny text. They make eyes glaze over, even for the most dedicated coach or player.

The solution isn’t less data—it’s smarter visualization. Your goal is to turn numbers into a story everyone can grasp in seconds.

Let’s start with trends. Instead of listing weekly stats, use a mini-chart. A simple line or bar chart embedded right on the slide shows performance over time instantly. Did shooting accuracy dip in mid-season? A mini-chart tells that story visually, without a single spoken word.

For spatial understanding, shot maps or pitch charts are game-changers. They show where attempts are coming from on the field or court. A cluster of dots in the paint? That’s a powerful visual argument for a defensive adjustment. These maps give immediate, intuitive insight.

Want to communicate effort or tempo? Enter the pace bar. This simple, horizontal bar can fill up to show intensity levels, sprint distances, or speed metrics. It’s a brilliant way to compare effort between players or across quarters.

Now, a critical warning: avoid the clutter of a traditional, dense heatmap. Unless it’s the absolute best tool, a complex heatmap often confuses more than it clarifies. A simpler, focused graphic is almost always more powerful. Remember, your slide is a spotlight, not a floodlight.

This is where slide hierarchy becomes your secret playbook. Never lead with the raw data. Always start with the big-picture conclusion. Use a bold headline like, “Shots Improved in the 4th Quarter” or “Defensive Pressure Increased After Timeout.” Then, and only then, use your mini-chart or map to prove that point. The visual supports the message, not the other way around.

To help you choose the right tool, here’s a quick guide:

Visualization Type What It Shows Best Pro Tip
Mini-Chart Trends over time (e.g., points per game, completion %) Keep it to one clear metric. Two lines max!
Shot Map Spatial patterns (e.g., shot locations, defensive coverage) Use contrasting colors for makes vs. misses.
Pace Bar Intensity or effort levels (e.g., player speed, hustle stats) Combine with a key number (e.g., “Max Speed: 18 mph”).

By mastering these tools and applying clear slide hierarchy, you transform data pages from a chore to read into a compelling part of your presentation. You’re not just showing numbers; you’re revealing the story behind the stats. And that’s how you drive real decisions and win the room.

Build Once, Use Often: duplicate decks for scouting, reviews, installs

Your time is precious. Spending hours redoing slides for each meeting takes away from film study and player development. The best approach is to create a master template library. It’s your digital playbook of tried-and-true slide designs.

Start with a well-organized set of master slides, icon packs, and data pages. These become your base. For scouting reports, season reviews, or play installations, just duplicate your core deck and update the content.

This method ensures your presentations look consistent across your program. It saves you hours of repetitive work. Just like the customizable sports program PPTs available, good deck templates can be tailored to your team’s colors and goals without starting from scratch every time.

We help every member of your sports team create clear, effective presentations. You can focus on coaching, analyzing, and leading. A solid set of deck templates turns complex data into quick, easy-to-understand slides for any audience.

Infographics for Coaches: Turn Stats into Scouting Clarity

After every game, you face a huge pile of data. This includes passes, duels, shots, and tackles. It’s easy to get lost in spreadsheets and numbers.

But, the magic happens when you make this data easy to see. A good sports data infographic is like a translator. It turns hard stats into simple images. These images help your team quickly understand what needs to change to win.

This method uncovers key insights. You’ll see how well your team performs, how they convert chances, and their tactical moves. Suddenly, the whole game becomes a clear path for getting better.

In this guide, we’ll show you the whole process. You’ll learn to ask the right questions, pick the best charts, and share your findings. We’ll use examples like analyzing a midfielder’s pass success or showing a team’s pressing tactics.

Let’s make those confusing numbers work for you.

Define the Question: “What do we want them to do differently?”

Turn raw stats into coaching wisdom by focusing on one simple question. What behavior needs to change?

Before you start designing, the real magic happens in your mind. The best sports infographics aren’t just about looks. They answer a focused question that guides field decisions.

Imagine you have 90 minutes of match data. Counting passes or shots is simple. But does it tell players what to do differently? Probably not.

Our community shows that analysis should look at more than just passes. It should check the “progressive value.” It should compare expected goals (xG) to actual results. It should also measure tactical actions, like recoveries in the final third for a high-press plan.

So, how do you begin? Ask yourself: “What do we want our players, scouts, or coaches to do differently after seeing this?” Your answer will guide your design.

If you want them to understand why possession didn’t win games, ask about “Performance Efficiency.” Focus on the value of each pass. If finishing is the issue, center your question on “Conversion of Chances,” comparing xG to reality.

By defining this question first, you’ll know which KPIs to track. This focus turns a generic report into a targeted KPI dashboard that guides action. It tells you whether to adjust a drill, scout a new player, or change a game plan.

Remember, great sports infographics start with a ‘why,’ not a ‘what.’ Define the question, and you’ve already won half the battle.

Choose the Right Chart: location maps, timelines, bars vs slopes, percent tiles

Think of your data as ingredients; the right chart is the recipe that turns them into a meal your coaching staff can digest. You’ve defined your sharp scouting question. Now, you need a visual tool that answers it with instant clarity. Picking the wrong one creates confusion, but the perfect match makes your insight undeniable.

Let’s break down the go-to options. We’ll match each chart type to the specific question it answers best.

For spatial analysis, you need to see where things happen on the field or court. A location map or a shot chart is your best friend here. Want to show your striker’s favorite shooting zones or expose a soft spot in your defensive shape? A shot chart with simple dots for attempts and goals tells that story in seconds.

To show intensity or concentration, use a heat map. This visual is fantastic for displaying a player’s movement density, zones of high pressing activity, or areas where your team dominates possession. A heat map uses color gradients to make patterns pop, moving beyond simple location to show “how much” activity occurs there.

For trends over time, like tracking a player’s form across a season, you have two great choices. A simple timeline with data points works. But to really emphasize change and progression, use a slope chart. This chart connects key data points with a line, making the upward or downward trajectory impossible to miss. It’s more dynamic than a series of isolated bars.

When you need to compare players or units, turn to the classic bar chart. It’s the undisputed champion for side-by-side comparisons. Whether you’re comparing scoring averages between forwards or defensive stops between lineups, bars give a quick, clear visual ranking.

Lastly, for showing where a player ranks (e.g., “in the 85th percentile for progressive passes”), use percentiles or gauge charts. These visuals instantly communicate performance relative to a league or team standard. They answer the question, “How good is this, really?” at a single glance.

Remember, the goal is always clarity, not complexity. The best chart is the one that makes your players and staff say, “I see it now.” Your visuals should communicate strengths and weaknesses so clearly that the next action step feels obvious.

A detailed basketball shot chart heat map, vividly showcasing various shooting locations on a basketball court. The foreground includes a vibrant, color-coded representation of shot accuracy, with warmer colors indicating higher success rates and cooler tones showing lower performance areas. In the middle, the court is highlighted with accurate markings, including three-point lines, free-throw circles, and key zones, against a polished wooden floor texture. The background features subtle court-side details like bleachers and a scoreboard, softly blurred to ensure focus on the chart. The lighting is bright and clear, mimicking a well-lit gym environment, capturing a professional and analytical mood. The entire image is clean, clear, and devoid of any text, ensuring it conveys important scouting insights effectively.

Build a One-Pager: objective, 3 KPIs, 2 visuals, action notes

A player report card is more than a summary. It’s a guide that helps your team focus before practice. Busy coaches and executives need a quick, clear page. This one-pager turns complex stats into easy-to-understand insights. It’s your key to making sports data memorable and useful.

Let’s create your guide together. Every good one-pager has four main parts:

  • A Single Objective
  • Three Key KPIs
  • Two Core Visuals
  • Action Notes

Start with your one Objective at the top. Be clear and direct. Is it “Assess midfield control in the last game” or “Evaluate defensive transition speed”? This helps avoid getting lost in data.

Then, pick three KPIs that measure your objective. For example, if you’re focusing on midfield control, your KPIs could be Progressive Passes Completed, Final Third Recoveries, and Passes into the Penalty Area. These numbers tell the main story.

Next, add two visuals to support your KPIs. A pass map and a bar chart comparing your player to league averages are good choices. Think of a player profile in a scouting template—clear and impactful.

The Action Notes section is key. It turns data into coaching. For instance, “Player X excels at breaking lines with passes but needs to improve defensive positioning in transition; focus on shadow play drills this week.”

When you put these parts together, you get more than a document. You get a single source of truth. This one-pager keeps everyone—coaches and players—on the same page. It’s your data center for the week.

Visual Cues: team colors sparingly, danger/green zones, icons for roles

Visual cues are like a secret language for heat maps. They guide your eyes to important details without words. When done right, your infographic becomes a silent helper on the field.

Color is key, but use it wisely. Don’t cover your heat map in team colors. Use primary and secondary colors for key data or to show team differences. This makes important info stand out.

Set up clear zones on your heat map. Use a red “danger zone” for high-risk areas and a green for safe ones. This system quickly shows risk and safety. A coach should see the problem areas clearly without needing to read numbers.

Use icons instead of long text labels. A glove for goalkeepers, a boot for strikers, or a whistle for coaches is quicker to understand. This makes reviewing player progress fast and easy.

These visual cues—using color, zones, and icons—make stats clear. They turn a busy graphic into a tool for quick decisions. Your heat map is more than data; it’s a guide to the game’s key moments.

A detailed soccer heat map focusing on danger zones across a soccer field. In the foreground, overlay vibrant green and red gradients to signify safe and dangerous areas, respectively. In the middle, include icons representing player roles such as defenders, midfielders, and forwards, depicted using minimal team colors to maintain clarity. The background should be a stylized soccer field with a well-defined grid pattern. Use soft, diffused lighting to emphasize the zones, and apply a slight vignette effect for depth. Capture the atmosphere of strategic analysis and coaching insight, ensuring the overall look is professional and informative without any text or distractions.

Common Traps: rainbow heatmaps, dual Y-axes, tiny labels

Let’s look at the common mistakes that can make a great stat hard to understand. Even with the best data, some design traps can hide your insights. We’ve all been there—excited to share a finding, only to have the team squint at the chart in confusion.

Your goal is to make sports infographics and statistics clear and easy to read. Avoiding these three common errors will help you achieve this.

  • The Rainbow Heatmap Trap: It’s tempting to use every color in the toolbox. A vibrant, rainbow-colored heatmap might look exciting at first glance. But it often creates a confusing spectacle where high and low values blur together. Think of it like trying to find a specific player in a crowd where everyone is wearing a different jersey color.

The solution is simplicity. Use a single-color gradient, like light blue to dark blue for intensity. Or, use a clear two-tone system like red (low) to green (high). This creates an intuitive visual scale the brain can process instantly.

  • The Dual Y-Axis Confusion: Plotting two different metrics on one chart seems efficient. For example, showing distance covered and pass accuracy over time. But it forces the viewer to reconcile two separate scales at once. It’s like trying to listen to two different songs simultaneously—you can’t focus on either.

Instead, use two separate, aligned charts placed side-by-side. This allows for clean comparison without the mental gymnastics. Your players and coaches will thank you for the clarity.

  • The Tiny Label Problem: Never sacrifice legibility for space. Tiny fonts or labels are a major engagement killer. Remember, your infographic might be viewed on a phone screen in a dim locker room or printed on a board from a distance.

If people have to squint, they’ll disengage. Always prioritize large, clear text. It’s better to have one less data point than a point nobody can read. Your visual should communicate, not complicate.

By steering clear of these traps, you transform raw numbers into scouting clarity. Great data visualization in sports isn’t about fancy tricks. It’s about removing every possible barrier to understanding.

Workflow: collect → clean → sketch → test on 2 players → finalize

Think of your data visualization workflow like a coach’s playbook. It’s consistent, repeatable, and designed for success every time. Jumping straight into design software is a common mistake. Instead, a structured process ensures your final infographic is both clear and actionable.

This five-stage workflow mirrors the disciplined approach of a top scout. They establish criteria, identify targets, conduct assessments, and analyze reports. Your visual creation should follow a similar path from raw data to polished insight.

  1. Collect Your Raw Data

Gather everything from your tracking systems, video analysis software, and old-fashioned stat sheets. Don’t be selective yet; cast a wide net. This stage is about accumulation, ensuring you have all the pieces on the table before you start building the puzzle.

  1. Clean and Filter for Your KPI Dashboard

Here’s where you turn noise into signal. Filter out irrelevant events, correct any errors, and, most importantly, structure the data around your 2-3 key performance indicators. For example, if you’re analyzing build-up play, you might isolate completed passes only in the attacking third. This clean dataset is what will power your KPI dashboard and become the foundation of your visual story.

  1. Sketch the Layout on Paper

Resist the computer! Grab a notepad or whiteboard and map out where each element will go. Where does the headline sit? Which chart is the hero? How will the action notes flow? This quick sketch saves hours of digital trial-and-error and forces you to prioritize the message over cosmetic details.

This is your non-negotiable reality check. Show your draft to two players or assistant coaches. Can they grasp the main point in 10 seconds? Do they misinterpret a color or get confused by a chart label? Their fresh eyes will catch what you’ve become blind to. This feedback is pure gold for refining your approach to making sports data memorable.

  1. Finalize the Design

Incorporate the feedback from your test audience. Adjust colors for better contrast, clarify labels, and simplify any complex elements. This is where you polish the final product, ensuring your KPI dashboard or scouting report is ready for the locker room or strategy session.

Adopting this workflow might feel slower at first, but it guarantees a higher-quality output and saves immense time on revisions. You’re not just making a pretty picture; you’re engineering a tool for better decisions.

Print vs Screen: DPI, margins, light/dark modes

Before you finalize that coaching infographic, think about where it will be seen. Will it be on paper or a screen? The same sports infographics and statistics need different settings for paper and pixels. This ensures your message is clear, whether it’s on a poster or a player’s phone.

Preparing for print or screen is like planning for two different games. The strategy changes based on the field conditions. By optimizing for each medium, you make sure your data-driven insights are always ready.

For print, like handouts or posters, resolution is key. You need a sharp image that won’t get blurry when enlarged. Always export your files at at least 300 DPI (dots per inch) for professional printing. This keeps every detail clear.

Also, remember the printer’s limits. Most can’t print right up to the edge of the paper. Leave enough space on all sides and keep important info away from the edges. Losing a stat to a paper trim is a missed chance!


Optimizing for Digital Viewing

For screens, like tablets or phones, the rules change. Screen resolution can be lower (72-150 DPI is fine). Your new challenge is making it comfortable and adaptable.

First, consider the light. A bright white background can be too harsh in a dark room. Always test your visuals in different lighting. A dark background or softer colors can help players focus during film study.

Second, think about size. Text and icons need to be big enough for small screens. If players can’t read the numbers on their devices, the infographic fails to communicate sports infographics and statistics clearly.

Here’s a quick reference table to keep the key specs straight:

Consideration Print (Poster/Handout) Screen (Tablet/Phone)
Resolution (DPI) 300 DPI or higher 72-150 DPI is sufficient
Critical Design Rule Use wide, safe margins Test light & dark modes
Text & Label Size Visible from a distance Legible on small screens
Export Format PDF for sharp vectors JPG or PNG for quick sharing

Your Final Export Checklist

Modern tools make this process easy. Whether you’re using Google Slides, PowerPoint, or design software, you can save in multiple formats. Export a high-DPI PDF or JPG for print. Save a separate version for digital use.

By taking these final steps, your hard work will pay off. Your sports infographics and statistics will have maximum impact, wherever your team sees them. Now, let’s look at some templates to put all this knowledge into practice!

Template Kit: game summary, opponent scout, player progress card

You don’t need to start from scratch for every report. A template kit is like a visual playbook. It saves time and makes sure everyone uses the same language.

Start with a Game Summary template. It should have spots for the final score and three key stats. You can also include a possession flow chart and a shot map. Don’t forget space for post-match thoughts.

Then, create an Opponent Scout template. This sheet helps you understand your next opponent. It should have sections for their formation, key player tendencies, and set-piece strategies.

Lastly, make a Player Progress Card template. This card tracks a player’s growth over a season. Use graphs for their key metrics and add coach notes. A good player report card tells a story of growth with data.

Using professional templates means everyone speaks the same visual language. You spend less time on design and more on analysis. Your documents become powerful tools for your team.

From Analytics to Chalk Talk: Communicating Numbers Athletes Understand

Welcome, coach! Let’s be honest for a second. You’ve seen the spreadsheets full of numbers and the reports packed with complex metrics. You know this information is valuable for your team’s success.

But when you try to share it, your player’s eyes glaze over. Terms like “points per possession” or “effective field goal percentage” just don’t connect. That’s the gap we’re here to bridge together.

Your most important job isn’t just collecting data. It’s translating it into a language your athletes instinctively understand. Every single metric must become a specific, on-court action paired with a simple cue word.

Think of it as decoding a foreign language into the mother tongue of movement and effort. This skill to simplify stats using non-technical language is now critical. The sports world is more data-driven than ever, just like the business world around it.

By mastering this translation, you turn confusing reports into powerful conversation starters. For more on making sports data memorable, we have great strategies to share.

Let’s begin this journey. We’ll show you how to make every number matter.

Pick 3 KPIs Per Game: Efficiency, Tempo, Shot Quality

The secret to winning with data is not more numbers, but fewer, sharper ones. In today’s sports, we get a lot of information from all sides. Without a clear plan, it just gets confusing for athletes.

Think of your team like any top company. Structure and governance are key. You wouldn’t run a business without clear goals, right? Your game plan needs the same focus.

That’s why we follow the “Rule of Three.” Before each game, you and your team pick just three Key Performance Indicators (KPIs). These are the top priorities for that game and strategy.

This focused approach helps cut through the noise. Instead of tracking many metrics, your team focuses on what really matters. It makes a simple, shared language for everyone.

So, what makes a great KPI? We often start with three powerful, sport-specific categories:

  • Efficiency: Are we getting high-value outcomes from our possessions? In basketball, this could be points per possession. In soccer, it might be successful passes in the final third.
  • Tempo: Are we controlling the game’s speed? A football team might track plays per minute. A tennis player could focus on time between points.
  • Shot Quality (or Chance Quality): Are we taking the attempts we practice? For a shooter, it’s the percentage of shots taken within their preferred zones. For a baseball hitter, it’s the rate of hard-contact swings.

The exact game KPIs you pick must be sport-specific. A “shot quality” metric in volleyball looks completely different than in hockey! The magic is in the collaboration. When coaches and leaders choose these three indicators together, everyone from starters to staff understands the mission.

Here’s your simple framework for selection:

  1. Review your opponent’s key weakness.
  2. Identify your own team’s strength that can exploit it.
  3. Pick one KPI that measures the execution of that strength.

Do this three times, and you have your game plan’s backbone. You’ve now given your athletes a clear picture of success. They aren’t overwhelmed by data; they’re empowered by a clear goal. That’s how you turn analytics into action, one game at a time.

Visualize Simply: arrows, zones, stoplights; no decimals on walls

Visual coaching makes data easy to understand, like part of the game. No more taping up tiny numbers on walls. It’s confusing and ignored. Athletes’ brains work fast and love visuals during games.

Our goal is to make feedback clear and quick. When athletes see your feedback, they should know what to do right away. This is the power of visual coaching. We use simple symbols and colors that lead to action without thinking.

A dynamic sports coaching environment showcasing visual coaching techniques. In the foreground, a coach in professional business attire stands, pointing at a large, translucent board filled with simple, vibrant visuals: arrows indicating movement patterns, colored zones representing different areas of focus, and stoplight symbols denoting decision-making statuses. In the middle, a diverse group of athletes attentively observes, wearing modest casual clothing, with expressions of concentration and curiosity. The background features a well-lit gymnasium with high ceilings, equipped with training equipment and motivational posters. Soft natural lighting creates an inviting atmosphere, emphasizing clarity and simplicity in communication. The composition conveys a sense of teamwork and engagement in understanding complex analytics through visual aids.

  • Directional Arrows: A simple up arrow (↑) for “faster tempo” or a down arrow (↓) for “slower pace” is clearer than “0.92 possessions per minute.”
  • Color-Coded Zones: Use green for high-quality shots and red for low-efficiency zones. This turns data into a spatial guide players can follow instinctively.
  • The Stoplight System: Green means “on target,” yellow signals “needs work,” and red flashes an “alert.” It gives immediate feedback on any KPI.

Remember, no decimals on the walls. We’re choosing a big, green “GO” signal over “0.48 Points Per Play.” Which one motivates your team more?

This method works because it matches how athletes see the game. They read body language and react to colors and shapes quickly. Visual coaching gives them a clearer view of the sport they love.

Start small. Choose one KPI from your last game and think: “How can I show this as a color, shape, or symbol?” Your team will quickly connect with the numbers when they’re shown as a visual story.

Storytelling: before/after frames, cause→effect sequences

The most powerful coaching tool isn’t a spreadsheet; it’s a well-told story built from data. Players and unions connect with fans on social media by sharing stories, not spreadsheets. This shows the power of narrative in making analytics stick.

Data tells a story, and you’re the narrator. By framing stats as a compelling narrative using non-technical language, you turn dry numbers into lessons athletes feel. This connects the “what” of the stat to the “why” and “how” of real gameplay.

Our brains love visual stories. Use video clips to create instant “aha!” moments. Instead of saying, “Your defensive positioning efficiency was low,” show two frames side-by-side.

Point to the screen and say: “Look at your stance here, before the pass. Now, look here, after you reacted. See how your feet are planted in the ‘before’? In the ‘after,’ you’re already moving toward the open lane.”

This method makes feedback clear and undeniable. It’s not you criticizing; it’s the story the video tells. You’re using non-technical language to highlight a clear, visual difference.

Connect the Dots: Cause-and-Effect Sequences

Stories have plots: this happened, which led to that. Build these sequences from your data to show players the direct impact of their actions.

For example: “When we set this specific screen (the cause), it leads to an open lane for a drive (the effect) 80% of the time. Let’s watch the three plays where we did it right.”

This sequence does the heavy lifting. The player sees their action as the starting point of a chain reaction. They stop thinking about a “good” or “bad” stat and start understanding their role in the system’s outcome.

Here’s a quick comparison to see how shifting from technical jargon to storytelling changes everything:

Aspect Technical Data Presentation Storytelling with Non-Technical Language
Language Used “Your off-ball movement velocity decreased by 15%.” “When you waited here, the defender caught up. When you exploded from the spot, you got open.”
Player Engagement Eyes glaze over; feels like a critique. Leans in; sees a puzzle being solved.
Lesson Retention Forgotten by the next drill. Remembered as a clear picture or story.
Primary Goal Report a metric. Explain a why and teach a how.

By storytelling with data, you help athletes internalize lessons on an emotional and instinctive level. The desired behavior becomes part of their muscle memory because they understand the story behind it. They’re not just remembering a number; they’re remembering a moment they saw and felt.

Start your next film session with this question: “What’s the story this clip is telling us?” You’ll be amazed how quickly the conversation shifts from confusion to clarity.

Reinforcement: on-field tags, hand signals, post‑rep callouts

Data becomes instinct when we use it in practice. Your chalk talk ideas are clear, but they need constant reminders. Reinforcement turns theory into automatic action.

Now, let’s go from chalkboard to field. Start with simple, on-field verbal tags. These are one-word shouts that act as instant behavior cues. For example, “Tempo!” reminds a point guard to speed up. “Efficiency!” is called out after a smart pass.

These tags are quick and keep play moving. They help focus on your key performance indicators (KPIs).

But sometimes, shouting can disrupt the flow. That’s when silent, sideline hand signals come in. A coach might hold up three fingers for “focus on our third KPI.” A closed fist means “lock in on defensive efficiency.” This method is clear and doesn’t stop the game.

The most powerful tool is the immediate post-rep callout. Right after a play, you praise the specific behavior. “Great job finding the green zone on that shot, Sarah!” or “Perfect tempo on that fast break, team!” This links the action directly to your data framework in real-time. The feedback is instant. This makes the lesson stick.

Verbal tags, hand signals, and post-rep praise create a feedback loop. They turn abstract ideas into real experiences. Your athletes start to feel the data, not just think about it. This is how you build a culture where data-driven behavior cues are part of the game.

Micro-Assessments: 60-second quizzes, thumbs scales

Communication isn’t just about what you say. It’s about what others understand. Micro-assessments are your quick tools to check if they get it. Forget long exams or lectures. These fast checks tell you if your team is on board.

Imagine checking the room’s temperature. After a film on defensive transition, ask: “Show me with your hand—thumbs up, sideways, or down—how you think we did today.” In seconds, you see the whole group’s view. It’s instant feedback that needs no prep.

A dynamic, engaging scene illustrating the concept of micro-assessments in sports analytics. In the foreground, diverse athletes, dressed in professional athletic gear, are interacting with digital devices displaying colorful, simplified stats visualizations. Some athletes are giving thumbs-up or thumbs-down gestures, while others are engaged in a fast-paced 60-second quiz. In the middle ground, a well-designed sports training facility with bright LED lighting casts a motivational glow, enhancing the atmosphere of urgency and focus. The background features motivational banners with abstract representations of data analytics, emphasizing sports performance. The overall mood is energetic and collaborative, suggesting an environment where quick feedback translates into improvement, showcasing athletes understanding their stats in real-time. Use a wide-angle lens for depth and clarity.

Another method is the 60-second quiz. Ask a focused question after a talk. “What was our top priority in the third quarter?” Give them a minute to think. This makes them recall the main idea you discussed.

Use a 1-5 confidence scale on a whiteboard too. Write a key play or stat and have players rate their confidence. It’s not about right or wrong. It’s about their gut feeling and understanding.

These tools do two important things. They give you insight right away. You see what they don’t get before the next practice. They also make players active in their learning. To rate or score, they must process and simplify stats into a personal judgment. It turns data review into a two-way conversation.

Here’s a quick comparison of common micro-assessment tools you can use today:

Method What It Measures Time Needed Best For
Thumbs Scale (Up/Side/Down) Overall sentiment & gut feeling 10-15 seconds End-of-session pulse checks
60-Second Verbal Quiz Active recall of a single key point 60 seconds Reinforcing a major teaching point
Confidence Board (1-5 Scale) Individual confidence in a specific skill or play 2-3 minutes Pre-practice readiness checks

These checks are simple. There’s no grading, no pressure, and no complex setup. They fit easily into your routine. Regular use builds a habit of reflection. Players learn to simplify stats for themselves. This creates a culture where understanding is key.

So, after your next talk, don’t just walk away. Take the temperature. That quick show of hands or silent mark on the board is your most honest report card. It keeps communication flowing both ways and ensures your chalk talk translates into on-field action.

Closing the Loop: measure change on next report

The final step turns your data into a story of growth. You’ve shared your key game KPIs with clear visual coaching. Now, it’s time to close the loop.

Look at the next game report. Show your team how you’ve improved. “Last week, our paint touches were in the yellow zone. We worked on it in practice. Now, this game, we’re in green!” This shows your efforts pay off.

This proves their hard work is worth it. It turns analytics into a tool for getting better. Teams, like those in the NBA or NFL, must use new data to grow. Your review is that moment.

Celebrate the wins on the report. Talk honestly about areas that need work. Then, work together to set goals for the next cycle. This builds a culture of continuous learning.

Your visual coaching system drives progress. By always measuring change, you keep everyone motivated. The loop is closed, and the cycle of improvement starts again.

Scouting Reports That Stick: Visual Templates for Opponent Prep

Welcome, coach! Before we dive into drawing X’s and O’s, let’s talk about building a rock-solid foundation. Every great game plan starts with understanding your opponent, not just collecting random notes.

Think of your three non-negotiables as the immovable pillars of your strategy. These are the core strategic truths you simply won’t compromise on, no matter what.

What can’t we allow the other team to do? Is it giving up corner threes? Letting their star point guard get into the paint at will? Professional templates, like those used in the NBA, help you pinpoint these critical tactical keys by organizing team info, offense, defense, and player tendencies.

By starting with your non-negotiables, you build a focused, actionable filter for all the information you gather. This step transforms an overwhelming pile of data into a clear path to a winning strategy.

You’re not just doing opponent analysis; you’re unlocking essential insights into their playcalling and habits. Let’s turn those insights into your next victory!

Visual Tiles: lineup map, top 5 actions, pressure/press zones, and late-game habits

Imagine having a dashboard that shows everything you need to know about your opponent at a single glance. That’s the power of visual tiles. Our brains are wired for pictures, processing images thousands of times faster than text. By translating your scouting notes into clear, at-a-glance visuals, you give your team an instant, shared understanding of the challenge ahead.

Think of these tiles as the building blocks of your game plan. Each one covers a critical aspect of opponent prep. When combined on one page, they create a complete picture of the other team’s identity. Let’s break down the four essential tiles you need to build.

The Lineup Map: Start with who’s on the floor. A simple court diagram with player numbers and positions replaces a confusing paragraph of text. Using a printable Basketball Court Diagram, you can sketch their common lineups. Is their point guard always in the left corner? Does their center float to the high post? This map makes spatial relationships obvious to every player.

Top 5 Actions: Next, list their bread-and-butter plays. Don’t overload your team with twenty options. Boil it down to the five actions they run most often. This could be “Spain Pick-and-Roll,” “Horns Flare Screen,” or “Baseline Out-of-Bounds Lob.” Write them as short, actionable bullet points. This tile answers the question: “What are we going to see over and over again?”

Pressure/Press Zones: This is where pressure maps become your best friend. Where do they trap? Do they full-court press after made baskets? Use a shot chart template or a blank court diagram to shade the areas where their defensive pressure is highest. A visual pressure map is clearer than any verbal description. It instantly shows your guards where the double-teams come from and tells your posts where passing lanes might be open.

These tools, like those found in a comprehensive template pack, revolutionize how you track defensive tendencies. They provide a visual representation of your game plan on a single page. Creating these pressure maps forces you to identify patterns. You’ll see if they always trap the sideline or if their press has a weak side you can exploit.

Late-Game Habits: Lastly, how do they behave when the clock is winding down? Do they isolate their star for a last shot? Do they foul immediately when down by three? Note their crunch-time tendencies in a separate tile. This prepares your team for the moment when the game is on the line. There’s no need for a frantic timeout explanation if everyone already knows what’s coming.

Together, these four visual tiles form a powerful one-page scout. They turn abstract data into concrete pictures. Your players won’t just hear the plan; they’ll see it. This shared visual language ensures everyone is on the same page—literally. Start with a lineup map, add their top actions, layer in the pressure maps, and finish with their late-game personality. You’ll have a scouting report that sticks.

Player Cards: photo, role, hand/footedness, 2 strengths, 1 exploit

Player Cards turn unknown jersey numbers into known opponents. They are like strategic baseball cards. They help you win player matchups.

Instead of just guarding “jersey #5,” you now know “the left-handed shooter who hates driving right.” This change is powerful. It makes your defense more personal.

We create these cards from data on player skills. You track shooting and ballhandling. Then, we make a one-sheet profile. Our goal is actionable intelligence, not just info.

Every Player Card has five key parts. Here’s what they mean and why they’re important:

Card Component What It Tells You Why It Matters for Matchups
Photo Quick visual identification during play. No confusion on switches; defenders lock in instantly.
Role Primary scorer, facilitator, defensive stopper, etc. Reveals their job on the court and where your attention should be.
Hand/Footedness Dominant hand (right/left) for shooting and driving. You can force them to use their weak side, disrupting their rhythm.
Top 2 Strengths Their go-to moves and most reliable skills. You know what to take away, making them uncomfortable.
1 Exploitable Weakness A single, targetable flaw (e.g., poor right-hand dribble, slow in transition). Provides a clear, simple instruction for your defender: “Force him right every time.”

You give these cards to the defender facing that opponent. It gives them a clear game plan. They know exactly what to force and what to prevent.

This turns scouting data into action on the court. Your team feels more confident. They have a plan for every key player matchup.

Set Pieces: Stills → Arrows → Assignments → Counters

Imagine having a flashcard for every key play your opponent runs. These cards break down their movements into simple steps for your defense. This is the power of focusing on set pieces.

Set pieces include baseline out-of-bounds (BOB), sideline out-of-bounds (SOB), after-timeout (ATO) sets, and half-court initiations. They are rehearsed, making them predictable. For a prepared defense, this predictability is a gold mine for steals and stops.

We break down these complex plays into a clear, four-step visual progression. This method turns any play diagram into a story every player can understand and remember.

Step 1: Stills

Start with a static image of the play’s initial setup. Use a blank court template to draw where all five offensive players begin. This is your baseline. It answers the question: “What does it look like when the referee hands them the ball?”

Step 2: Arrows

Next, add movement. Use arrows to show where each player is designed to go. Does the point guard flare to the corner? Does the big man set a screen and roll? The arrows reveal the play’s intended path.

Step 3: Assignments

Now, assign your defensive responsibilities. Mark which of your players is responsible for denying the first pass, who helps on the roll, and who stays home on shooters. This step turns observation into a specific job for each defender.

Step 4: Counters

Lastly, diagram your planned counter. If they run this specific BOB play, will you jump the passing lane? Will you switch all screens? This is your rehearsed response, turning their organized attack into your defensive opportunity.

By following these four steps, you create a set-piece card. It’s a single, visual reference for one specific opponent play. The best part? You can build a whole library of them using the blank playbook templates from professional scouting resources.

These templates give you ready-made courts for drawing full-court plays, offensive sets, and all out-of-bounds situations. You’re not starting from scratch; you’re filling in the blanks with your opponent’s tendencies.

A detailed diagram of a basketball set-piece card, showcasing a four-step progression: stills, arrows, assignments, and counters. The foreground features clear, labeled diagrams illustrating players in action poses, arranged methodically to depict the sequence of movements. In the middle layer, arrows connect various player positions, highlighting their intended paths and tactical roles, with distinct color coding for easy interpretation. The background includes a basketball court outline for context, with a subtle gradient to avoid distraction from the main elements. The lighting is bright and focused, enhancing the clarity of the diagrams. The overall mood is analytical and professional, conveying a sense of strategy and preparation, ideal for a scouting report visual.

With a set of these set-piece cards, your team learns to “read” plays as they happen. Instead of reacting in confusion, players recognize the initial setup (the stills), anticipate the movement (the arrows), and execute their job (the assignments and counters).

This preparation turns game-time stress into confidence. When the other team calls a timeout to draw up a special play, your team already has a flashcard for it. You’ve changed the script, making their most organized moments your best chance to get a stop.

Start building your library of set-piece cards today. You’ll give your players a visual playbook that turns complex scouting into clear, winning actions.

Game Plan One-Pager: “if/then” boxes and clock management notes

We turn pages of notes into a one-page guide. It uses “if/then” logic and clock management. This is your final, master document. It combines all the great work from your visual tiles, player cards, and set pieces into one powerful sheet.

Think of it as your team’s game-day cheat sheet. It’s not a long book to read; it’s a quick guide for action. Just like a well-structured practice plan streamlines your drills, this one-pager makes your in-game decisions quicker and more informed.

Feature Complex Scouting Report Game Plan One-Pager
Primary Goal Information gathering & analysis Instant communication & execution
Format Multiple pages, detailed text One page, visual & bullet-pointed
Best For Coach preparation during the week Player review on the bus & during timeouts
Core Content Raw data, tendencies, full video notes Distilled “if/then” rules & clock management notes

The “if/then” boxes are key. They prepare your team for anything. For example: “IF they double-team our star guard, THEN our forward cuts to the open space for an easy pass.” Or, “IF they press after a made basket, THEN we inbound to our primary ball-handler immediately.”

You list the most likely scenarios you scouted. Then, you provide the clear, rehearsed response. This turns panic into quick action.

Clock management notes are also key. These are reminders for end-of-quarter or end-of-game situations. If the opponent presses with 30 seconds left, note it here. If they foul when down by three, write the plan. This ensures everyone knows the script when it matters most.

Let’s build your one-pager. You’ll create two main sections:

  • The “If/Then” Battle Plan: List 3-5 of the opponent’s most predictable actions. Next to each, write your team’s counter-move in simple language.
  • Clock & Situation Rules: Bullet points for last 2 minutes of each half, overtime procedures, and special inbound plays.

When you’re done, you can hand this sheet to any player. They will know exactly what the team’s priorities are. It prevents confusion and keeps everyone aligned to the game’s flow. This document turns your week of preparation into focused, on-court action.

Distribution Plan: captains’ packets, position group boards, bus review

It’s time to share your hard work with your team. A great scouting report is useless if it’s only in your hands. We need to make sure it reaches every player!

Your plan is like the game day logistics for your scouting report. It’s about giving the right info to the right people at the right time. A Basketball Template Bundle for Coaches can help make this process smooth and easy.

Your plan should have three key delivery channels:

  • Captains’ Packets: Give your team leaders more than just the basics. Include deeper insights and plans for different situations. This helps them coach on the court and keep the game plan alive.
  • Position Group Boards: Don’t overwhelm your players with too much info. Create boards for each group. Guards learn about other guards, and posts learn about the paint. This makes learning faster and more relevant.
  • Bus Review: Use the bus ride to review the game plan one last time. Focus on the top three team concepts and key opponent tendencies. This keeps the plan fresh in everyone’s mind.

A detailed visual representation of an "opponent tendencies distribution plan" displayed on a sleek presentation board. In the foreground, include three professional individuals in business attire, analyzing the board; one is pointing at a colorful pie chart, another taking notes, and the third observing thoughtfully. The middle layer features the board itself, adorned with graphs, statistics, and strategic notes about opposing team tendencies, with labeled sections for different position groups. The background showcases a modern conference room with large windows letting in natural light, highlighting a subtle, focused atmosphere. The mood should be serious and strategic, emphasizing teamwork and preparation. Use a wide-angle lens to capture the entire scene with sharp detail and professional lighting to enhance clarity.

This approach works because it respects each player’s role. A point guard doesn’t need to know about center footwork. By filtering the info, you make sure everyone learns what’s important for their job.

Using a template system makes this easy. Just fill in the slots for captains, guards, and posts. This consistent format helps players know where to find the info every game. It builds a routine of focused readiness.

The goal is for everyone to feel like they own the game plan. When players know their role against the other team’s habits, they play with confidence. Your scouting work helps the whole team execute better. That’s how you win the preparation battle before the game starts.

Postgame Update: what matched the scout vs what changed

Sharp coaches learn a lot after the game ends. It’s not just about watching game footage. It’s about checking if your prep was right.

Take out your pre-game visual tiles and pressure maps. Compare them with your game notes. We’ll look at key questions to close the loop.

  • What Matched? Celebrate your scouting wins! Did their defense match your lineup map? Did their star player use the foot you predicted for that shot?
  • What Changed? This is the key insight. Did they press in a different zone than your pressure maps showed? Did they use a new set-piece trigger we hadn’t seen?

This honest audit uses the data you tracked. Your Shot Chart Template is for more than live analysis. Use it post-game to check patterns. Did their shots go where you thought? Or did your defense force them into a tough spot?

This process isn’t about being “right.” It’s about getting better. Every difference between your scout and the game is a lesson. It sharpens your eye and makes your next plan stronger.

Make this a regular habit with your team. It turns every game into a lesson for the next one. For more on how to do this, check out these best practices for coaches and trainers. This reflective practice is what sets good teams apart from the best.

Template Pack: printable and mobile formats

You’ve built a visual playbook piece by piece. Now it’s time to bring it all together with a professional template pack. Imagine having every tool we discussed ready to use.

The Basketball Template Bundle for Coaches gives you that complete system. It includes the Scouting Report Template, NBA Scouting Report, Player Evaluation Form, Shot Chart Sheet, and Practice Plan Template.

These resources are designed to connect. Your player cards feed into your scouting report. Your shot charts inform your practice plans. Critical set-piece cards for offense and defense are part of the package, giving you ready-made visual anchors.

Created by coaches at Hoop Mentality, these templates turn complex prep into a straightforward process. You save hours that would be spent designing documents from scratch, including custom set-piece cards.

Access the pack in both printable PDF and editable digital formats. Print binders for your staff or share files directly to tablets. Your entire process becomes mobile and immediate.

This toolkit democratizes high-level preparation. You step into an organized workflow used by winning programs. Streamline your opponent analysis, empower your players, and make your game plan stick.

Get the template pack today. Elevate your coaching with visual tools that work.